
 Indonesia
  Português
  Tiếng Việt
  ไทย
ไทย  العربية
  हिन्दी
  简体中文
简体中文  Nederlands
  Français
  Deutsch
  हिन्दी
  Italiano
  한국어
한국어  Melayu
  Norsk bokmål
  Русский
  Español
  Svenska
  Tamil
Tamil  Türkçe
  Zulu
Zulu
In trading, a sideways market is considered a golden opportunity for you to make money on short trades. Today, I will show you how to apply the RSI indicator combined with Bollinger Bands to produce picturesque entry points in IQ Option. I will prove that this combination is simple but extremely effective. Let’s read!
Register IQ Option and Get Free $10,000 Risk warning: Your capital might be at risk.
Low volatility market is the time to make a profit in IQ Option
The sideways market is an opportunity for you to trade with short orders. Traders will act quickly as soon as they see market hesitation on the candlestick chart.
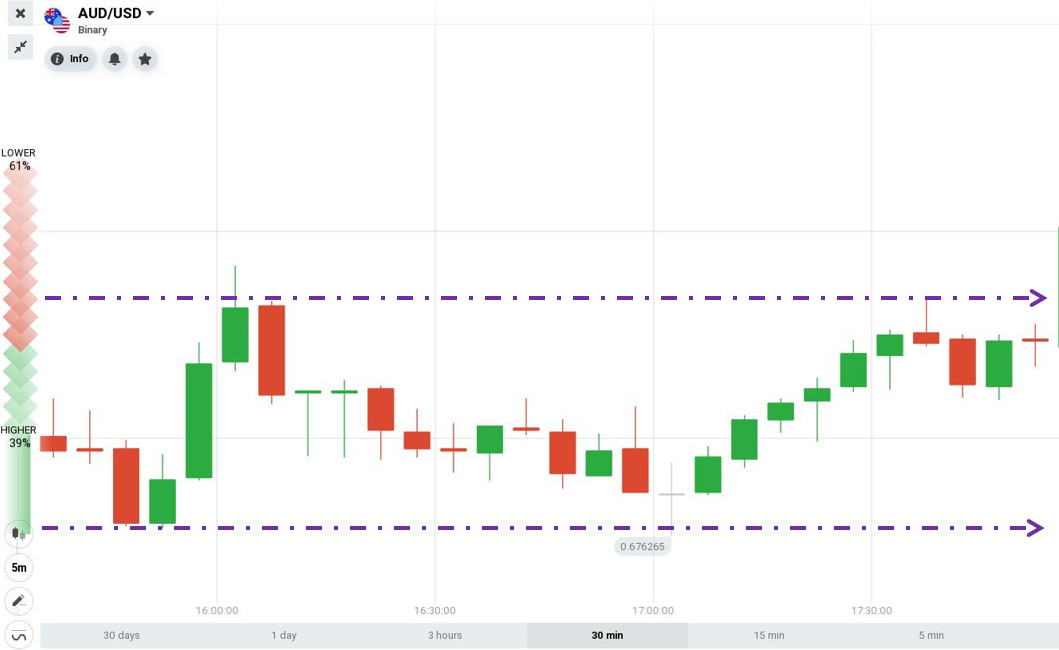
How to use the Bollinger Bands indicator in a sideways market
The Bollinger Bands indicator works well when used in low volatility markets. It helps you to quickly recognize the entry signal when the price closes outside the upper or lower band.
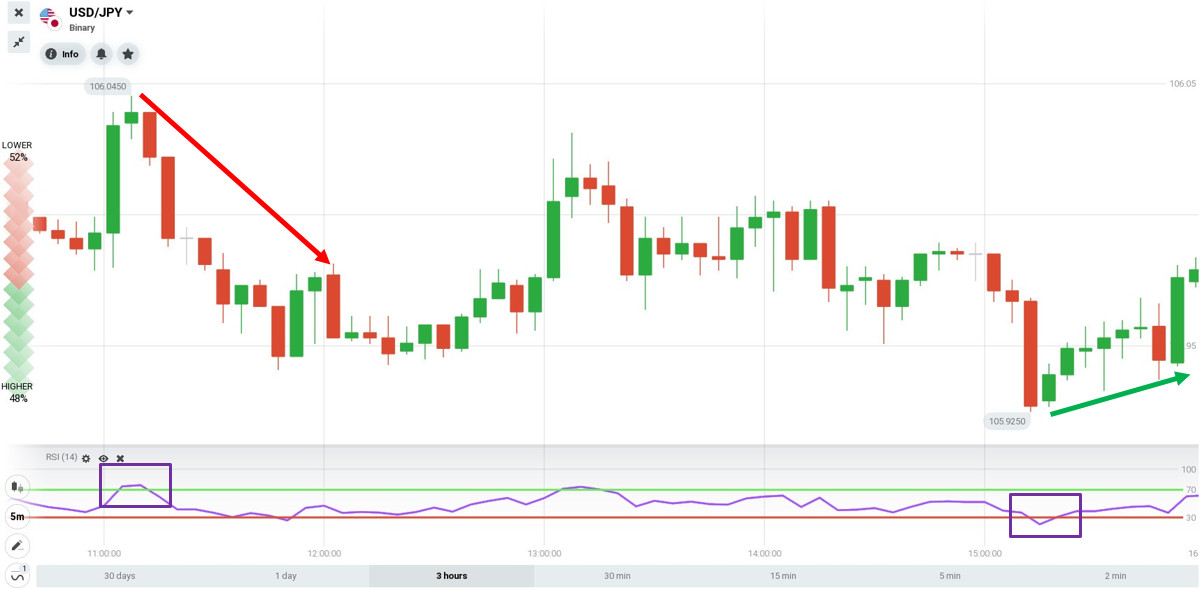
How to use the RSI indicator in a sideways market
The Relative Strength Index (RSI) is an index of relative strength, used to measure the speed and change of price movements. RSI fluctuates in a range from 0 to 100, reaching oversold when above 70 and reaching overbought when below 30. You can catch an exact reversal point when the price is in either of these two states.
How to trade when combining Bollinger Bands and RSI indicators in IQ Option
The Bollinger Bands and RSI indicators both have their own disadvantages. However, when combining them together, the transaction signals become accurate. I will guide you in more detail through the opened orders below.
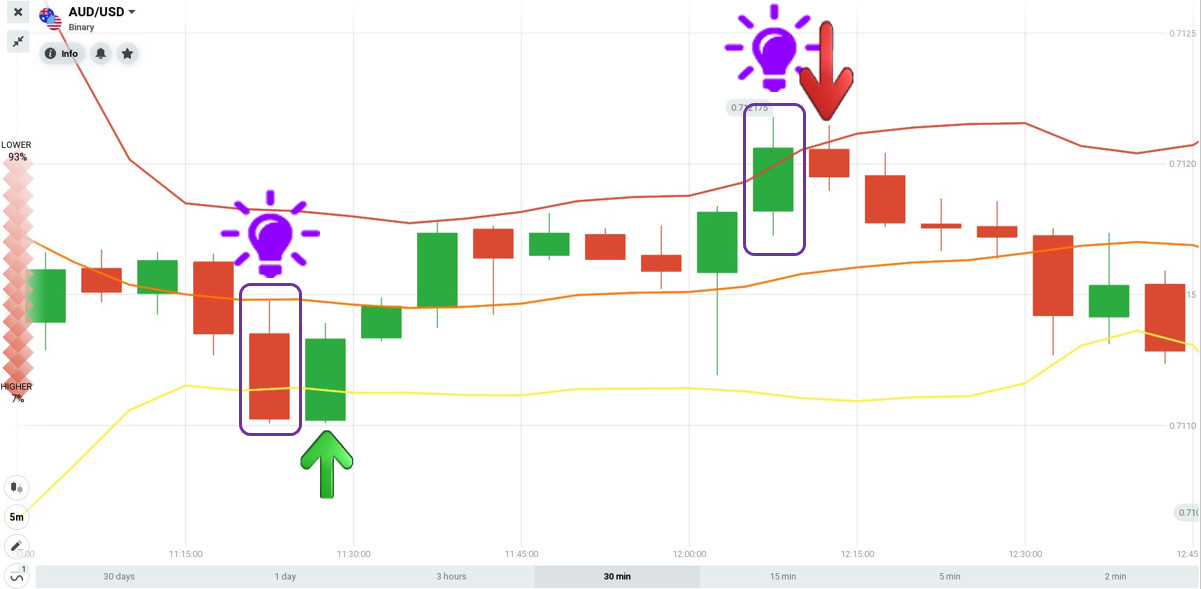
Open a HIGHER order when: the candlestick closes out of the lower band and the RSI points up from below the 30 level.
Open a LOWER order when: the candlestick closes out of the upper band and the RSI heads down from above the 70 level.
Review how to trade with Bollinger Bands and RSI indicators
Conditions: A 5-minute Japanese candlestick chart. Set up the Bollinger Bands and RSI indicators as default.
Currency pairs: USD/JPY.
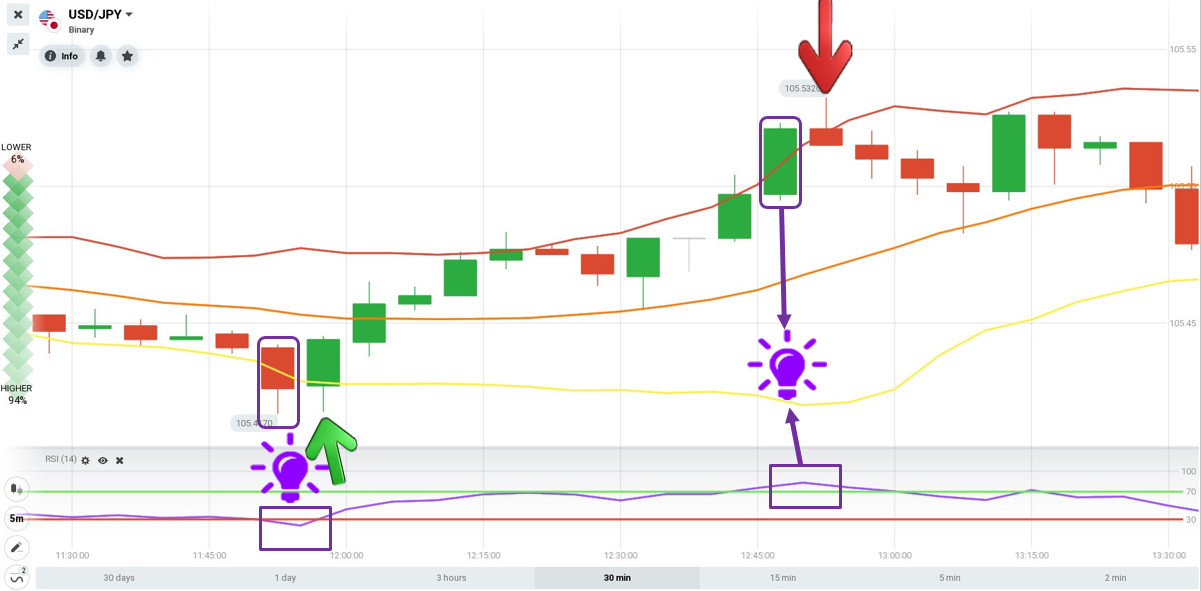
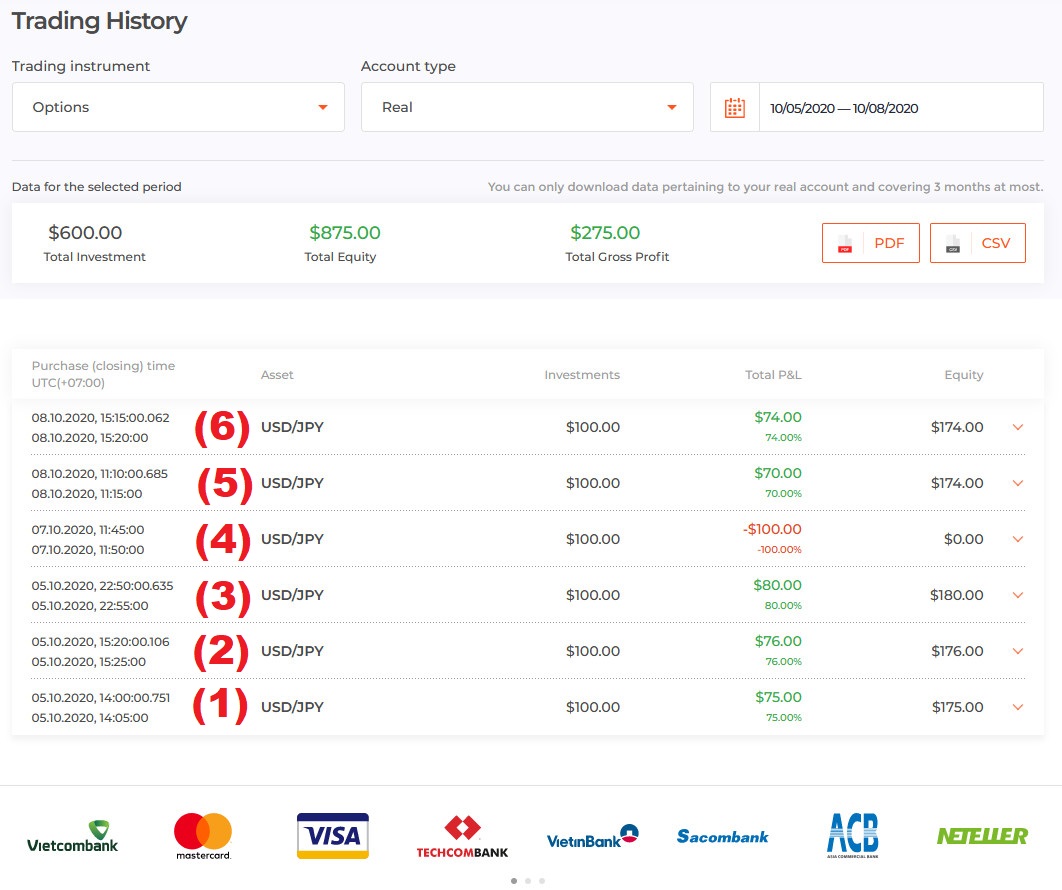
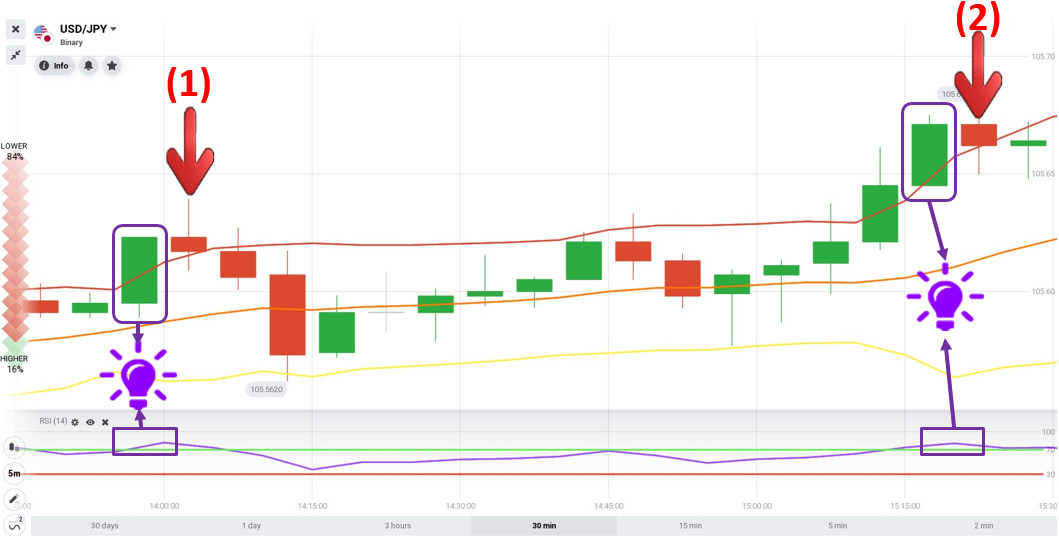
1st order: On October 5, with the USD/JPY pair, a candle closed out of the upper band when the RSI was pointing down from above the 70 level. Opened a LOWER order with an expiration time of 5 minutes for $100 => I won.
2nd order: With the same USD/JPY pair on October 5, a candle appeared to close out of the upper band. Right there, the RSI headed down from above the 70 level signaling overbought. Opened a LOWER order with an expiration time of 5 minutes => I won.
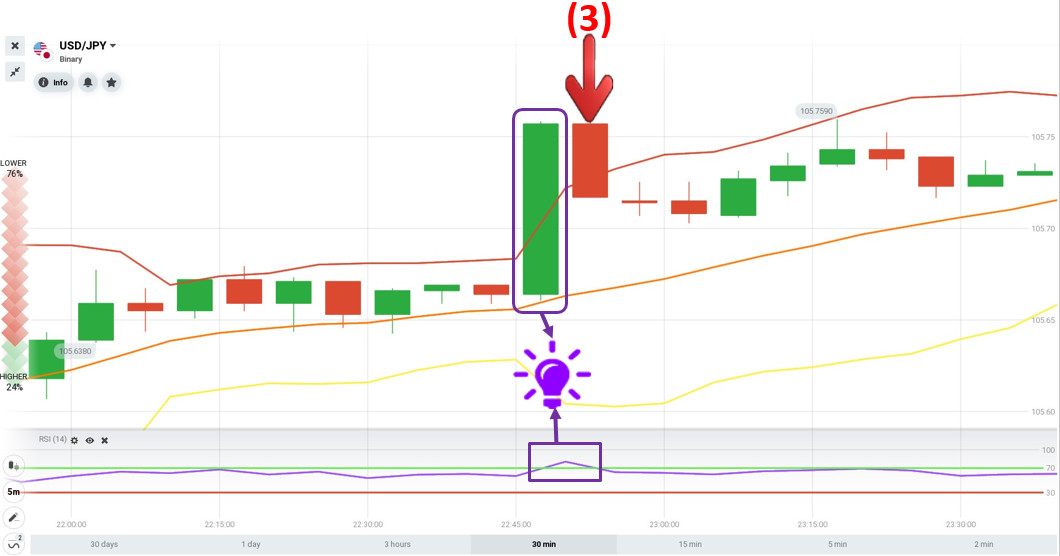
3rd order: On October 5, with the USD/JPY pair, a long green candlestick closed out of the upper band while the RSI was pointing down from above the 70 level. Opened a LOWER order with an expiration time of 5 minutes => I won.
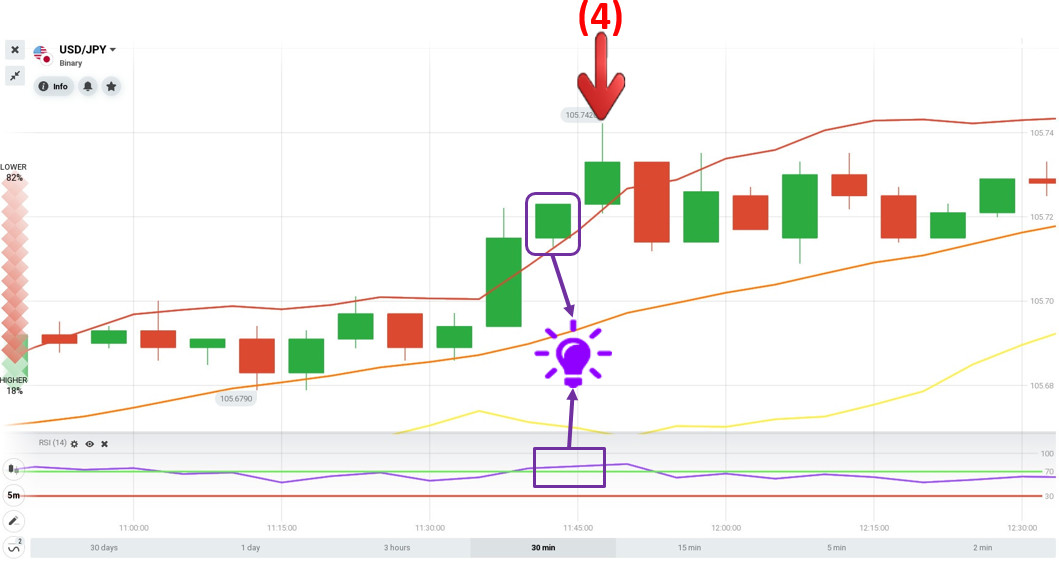
4th order: On October 7, with the USD/JPY pair, a candlestick closed 100% out of the upper band when the RSI was above the 70 level. Opened a LOWER order with an expiration time of 5 minutes => I lost.
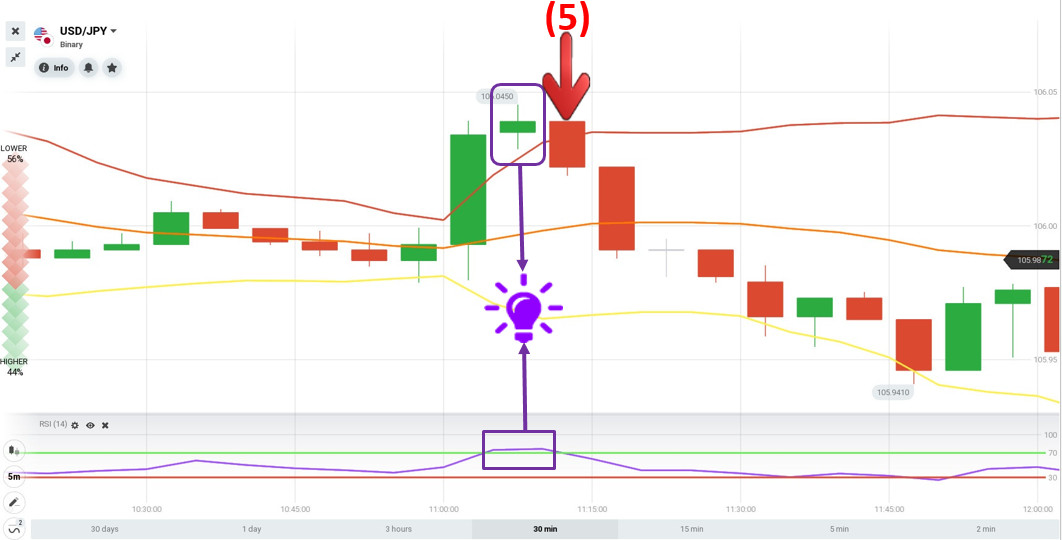
5th order: On October 8, with the USD/JPY pair, a candlestick that closed 100% out of the upper band appeared. The RSI indicator showed that the price was overbought when it headed down from above the 70 level. Placed a LOWER order with an expiration time of 5 minutes => I won.
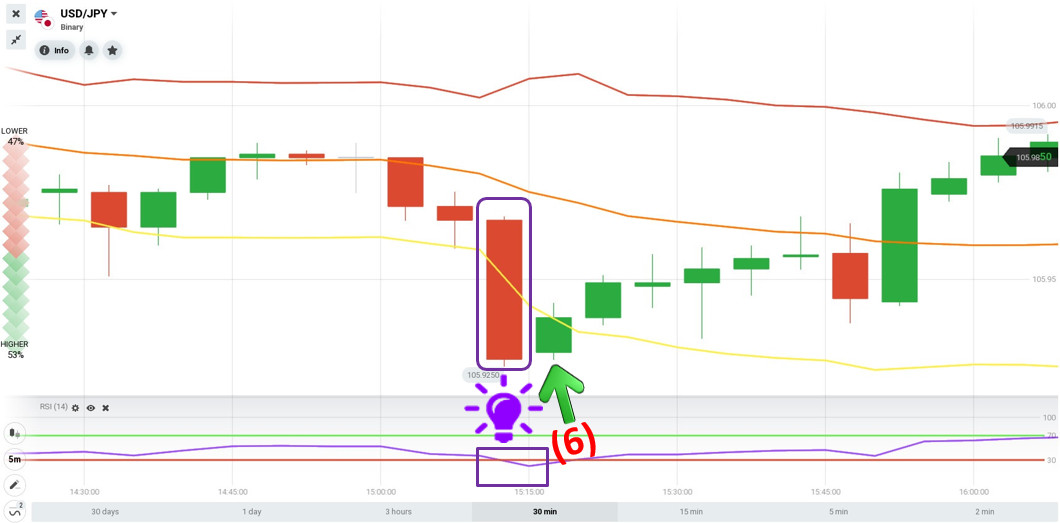
6th order: On October 8, with the USD/JPY pair, a candle closed out of the lower band. Right there, the RSI pointed up from above the 30 level. Placed a HIGHER order with an expiration time of 5 minutes => I won.
In conclusion
If you already have a trading strategy with a high win rate, then what are you waiting for without practicing it on a demo account? No matter how good a strategy is, it is meaningless if you skip the practice step. If you want to make money in IQ Option, you need to learn and practice at the same time. I wish you successful transactions.
Register IQ Option and Get Free $10,000 Risk warning: Your capital might be at risk.
Indonesia Português Tiếng Việt ไทย العربية हिन्दी 简体中文 Nederlands Français Deutsch हिन्दी Italiano 한국어 Melayu Norsk bokmål Русский Español Svenska Tamil Türkçe Zulu


