
 Indonesia
  Português
  Tiếng Việt
  ไทย
ไทย  العربية
  हिन्दी
  简体中文
简体中文  Nederlands
  Français
  Deutsch
  हिन्दी
  Italiano
  한국어
한국어  Melayu
  Norsk bokmål
  Русский
  Español
  Svenska
  Tamil
Tamil  Türkçe
  Zulu
Zulu
RSI indicator is one of the prestigious technical indicators for price and entry points analysis in IQ Option. Today, I will show you how to use RSI indicator and build appropriate strategies around it to trade options in IQ Option.
Register IQ Option and Get Free $10,000 Risk warning: Your capital might be at risk.
What is RSI indicator?
RSI (Relative Strength Index) is an indicator that measures the degree of price change. It is able to estimate the overbought or oversold of a currency pair.
Price trends determine the direction of RSI indicator. When the price falls, RSI decreases. When the price tends to rise, RSI increases.
RSI indicator – how does it work?
Set up RSI indicator in IQ Option
To create an RSI indicator: (1) Click on the indicator box => (2) Momentum tab => (3) Select Relative Strength Index.
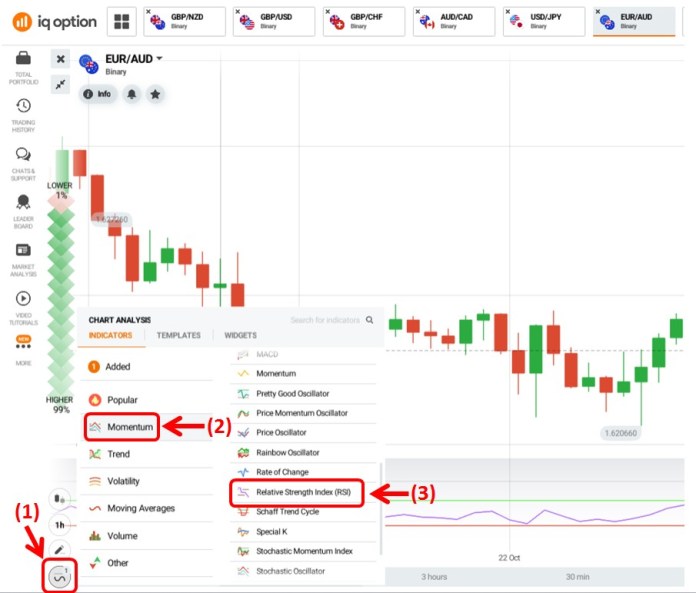
The basic color setting of RSI in IQ Option is purple. The green horizontal line (70) is the overbought zone. On the other hand, the red line (30) is the oversold zone.
How to use RSI indicator
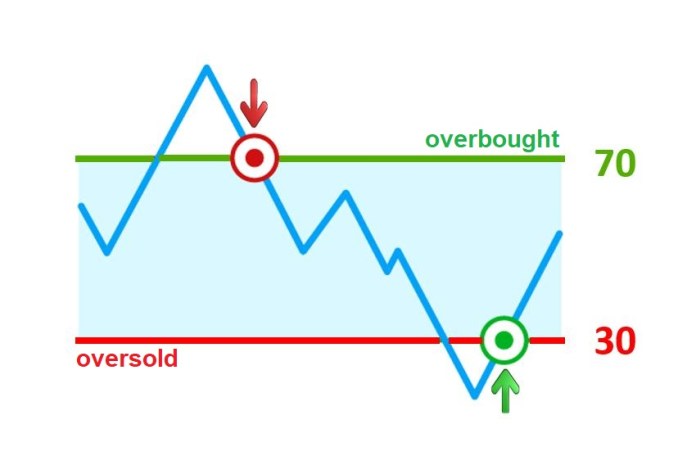
RSI indicator cuts the overbought or oversold
Normally, RSI indicator moves in the corridor from 30 (red) to 70 (green). And when it goes beyond this corridor, there is a high possibility that the price will temporarily reverse. This is an important signal for you to open a trade. For example,
• When RSI is moving above 70 but then returns and cut 70 (purple line crosses the green line) => open a LOWER option.
• When RSI is moving below 30 then returns and hit 30 (purple line cuts the red line) => Open a HIGHER option.
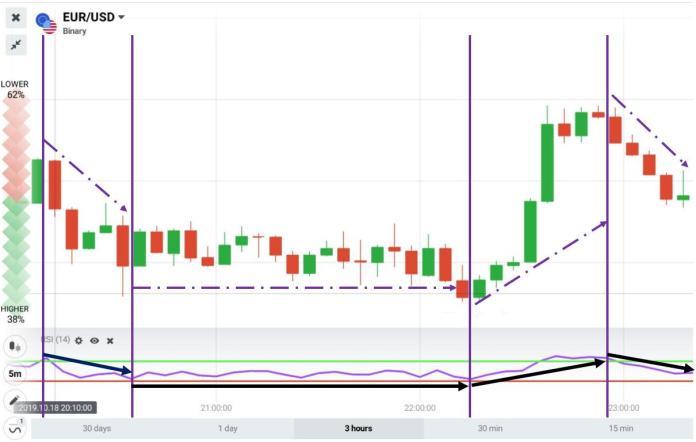
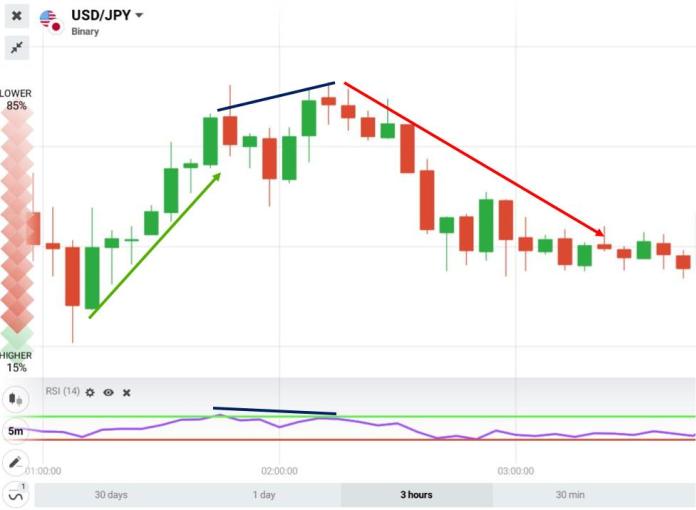
RSI divergence
RSI divergence is the phenomenon of RSI moving against the price. It means that the price goes up but the RSI is down. Or vice versa, the price goes down but the RSI is up.
Specific example:
Price is on a downward trend, but the RSI moves up. This is considered a divergence. => It signs a trend reversal, from downtrend to uptrend.
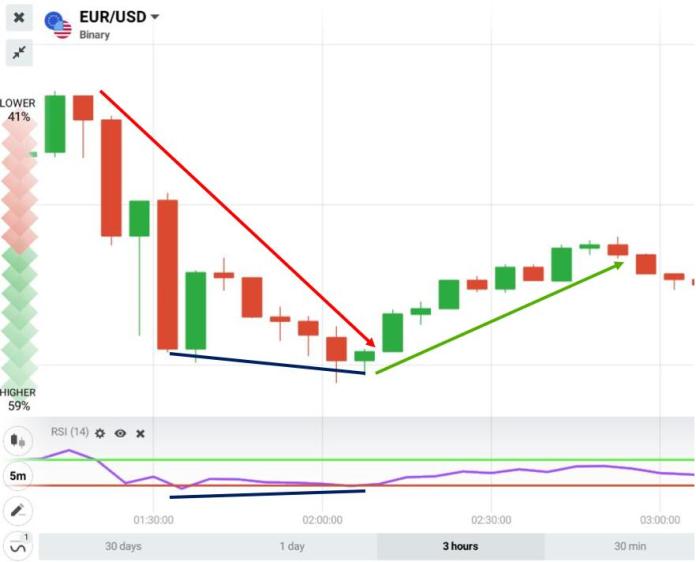
On the contrary, the trend is upward but the RSI falls => RSI divergence => The market will reverse from uptrend to downtrend.
IQ Option trading strategy with RSI indicator
RSI is a price trend indicator. Therefore, the best way to trade in IQ Option is to open options that are 15 minutes or longer.
There are many ways to trade in IQ Option for you to build a strategy that is consistent with the RSI.
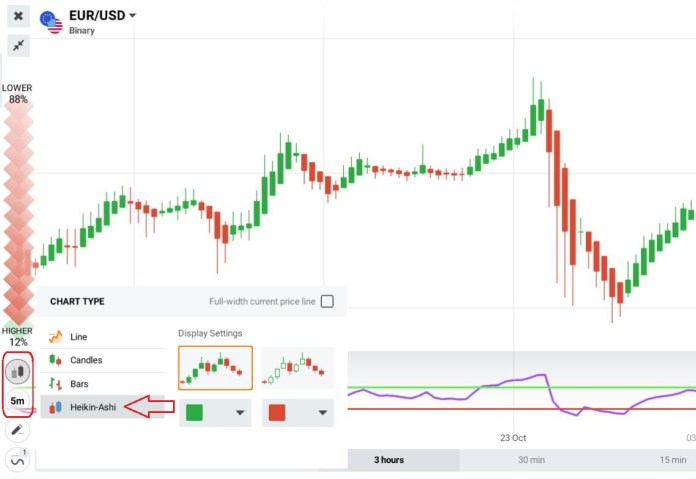
Method 1: Heiken Ashi candlestick chart + RSI indicator
Heiken Ashi is a type of candlestick chart that can predict the trend. Combining it with the RSI indicator will bring high efficiency when trading options.
Requirements: 5-minute Heiken Ashi candlestick chart + RSI indicator. The expiration time is 15 minutes or longer.
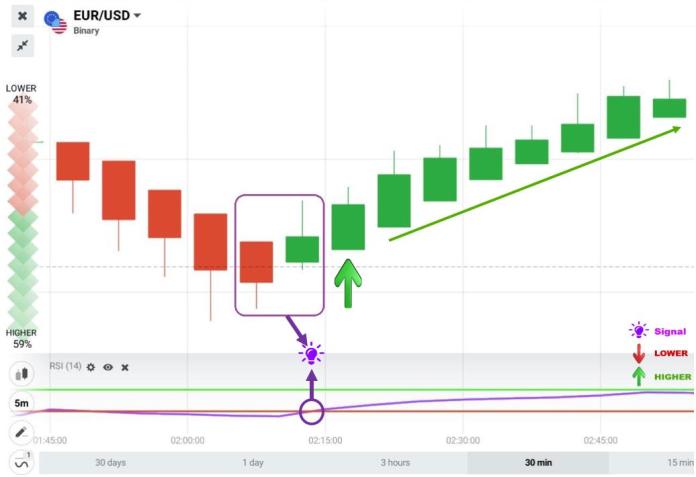
Trading technique:
Firstly, open a HIGHER option = Heiken Ashi candlestick chart changes from red to green + the RSI indicator from below 30 goes up.
Explanation: When Heiken Ashi candlestick chart changes from red to green => the price signs a reversal from downtrend to uptrend. When using it with RSI, the probability that the price will increase is even higher => Open a HIGHER option.
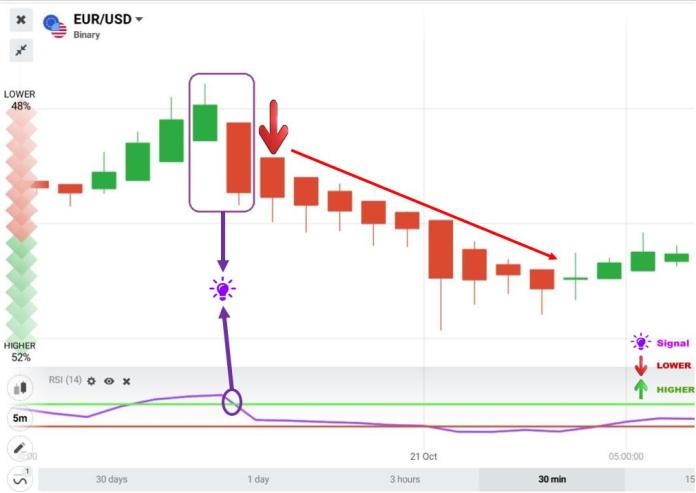
Secondly, open a LOWER option = Heiken Ashi candlestick chart changes from green to red + the RSI indicator from above 70 goes down.
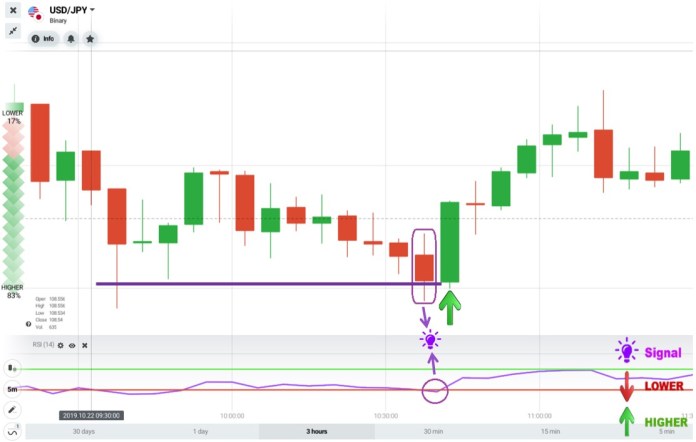
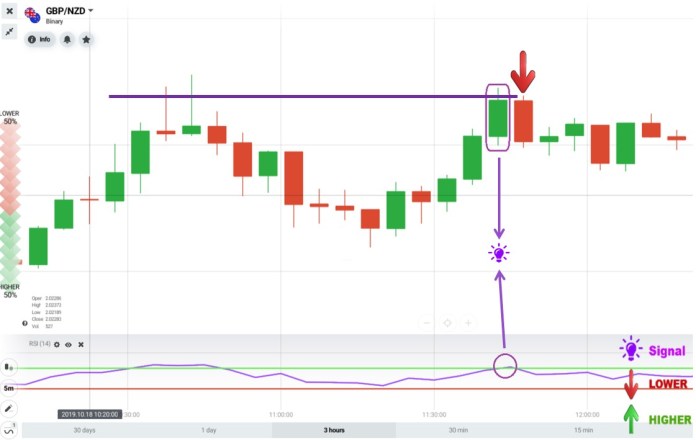
Method 2: RSI + support and resistance
When the RSI is in the overbought or oversold, the price has a high probability of reversing. Moreover, when we combine RSI with support and resistance, there will be more entry points to open options.
Requirements: Japanese 5-minute candlestick chart + RSI indicator. The expiration time is 15 minutes or longer.
Trading technique:
Firstly, buy a HIGHER option = The price enters the support zone + RSI is in the overbought.
Secondly, buy a LOWER option = The price enters the resistance zone + RSI is in the oversold.
Thank you for reading this article. Please register for an IQ Option free account in the box below. Love!
Register IQ Option and Get Free $10,000 Risk warning: Your capital might be at risk.
Indonesia Português Tiếng Việt ไทย العربية हिन्दी 简体中文 Nederlands Français Deutsch हिन्दी Italiano 한국어 Melayu Norsk bokmål Русский Español Svenska Tamil Türkçe Zulu


