
 Indonesia
  Português
  Tiếng Việt
  ไทย
ไทย  العربية
  हिन्दी
  简体中文
简体中文  Nederlands
  Français
  Deutsch
  हिन्दी
  Italiano
  한국어
한국어  Melayu
  Norsk bokmål
  Русский
  Español
  Svenska
  Tamil
Tamil  Türkçe
  Zulu
Zulu
Although you have been trading in IQ Option for a long time, there are some interesting things about the indicator that you do not know. In this article, we will clarify some concepts to understand the strengths and weaknesses of the leading and lagging indicators to determine which indicator will be more suitable for you.
Register IQ Option and Get Free $10,000 Risk warning: Your capital might be at risk.
Overview
Leading indicator will give a signal before a new trend or reversal forms.
Lagging indicator gives a signal after the trend has started and warns you to watch out for a new trend that has already begun.
At this point, many of you think “so I will make a lot of money with leading indicators”. Because it gives signals before and as soon as a new trend is formed. Of course, that will be true in certain situations of the market but it is not always absolutely correct.
When using the leading indicator for entry, you will face noisy signals. So you need to keep in mind that every indicator has its downsides that you need to accept.
As for the lagging indicator, it will give signals when the price has formed a clear trend. This drawback makes you late when entering orders.
Although these two types of indicators can support each other, they are opposites of each other. Now let’s take a closer look at them.
Leading indicator – Oscillator
A leading indicator (also known as an oscillator) is a tool that analyzes the ups and downs between two extremes, often referred to as the overbought or oversold zone to help investors find the best trading signals.
The oscillators that I have introduced are Parabolic SAR, Stochastic, and RSI. They are designed to predict a possible trend reversal.
Example 1
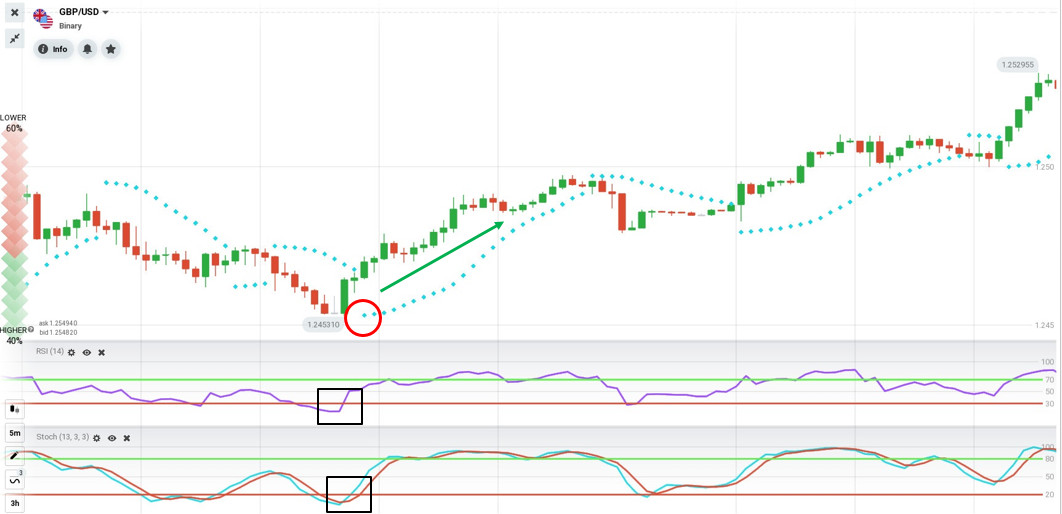
In the GBP/USD currency pair chart, I open the above 3 indicators. If you do not know how to trade, please review the previous articles.
All 3 indicators give a buy signal at the end of a downtrend as follows.
- RSI crosses the 30 (oversold) from below upwards.
- The Stochastic line crosses the 20 from below upwards.
- The Parabolic Sar signal is below the Japanese candlestick chart.
If you entered the trade right there, you would have made a big profit.
Example 2
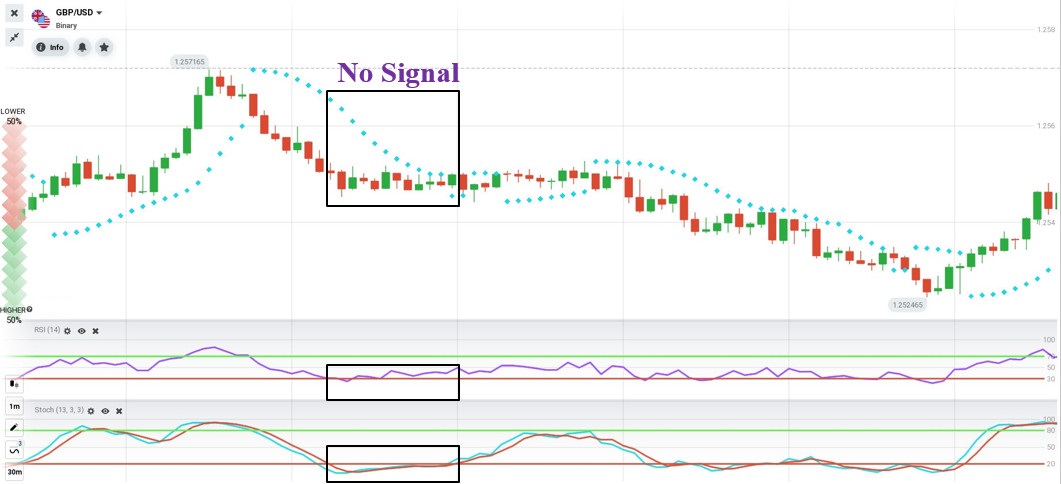
In this chart, you will see 3 indicators giving opposite signals. RSI and Stochastic give a bullish signal while Parabolic Sar has no consensus trading signal with the other 2 indicators.
If you entered the trade according to the signals of RSI and Stochastic, you may have lost money by ignoring the signal of Parabolic Sar. Due to different structural formulas, the signals are opposite. So signal conflict is a common occurrence when using multiple indicators. It is best to stay out of the market when the indicators being used give conflicting signals.
Lagging indicator – Momentum indicator
These are indicators that will help you see a trend when there is a change in momentum. MACD and MA (moving average) are 2 indicators that will help you do that. When indicating trends and trading signals, they have a lag level compared with the current price. However, there is a plus point that the signals will be less false.
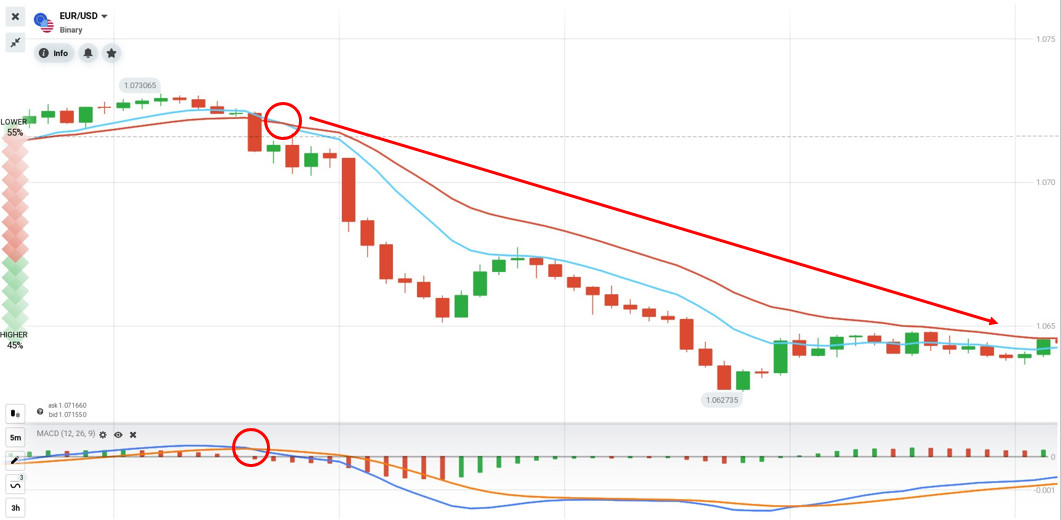
On the EUR/USD currency pair chart, we use 2 moving averages, EMA 10 (blue) and EMA 20 (red) combined with MACD. We then get a sell signal when the EMA10 crosses the EMA20 from above and the MACD intersects from above. If we open an order, we have a correct profitable trade.
Now, we will see another example to see how false signals can be.
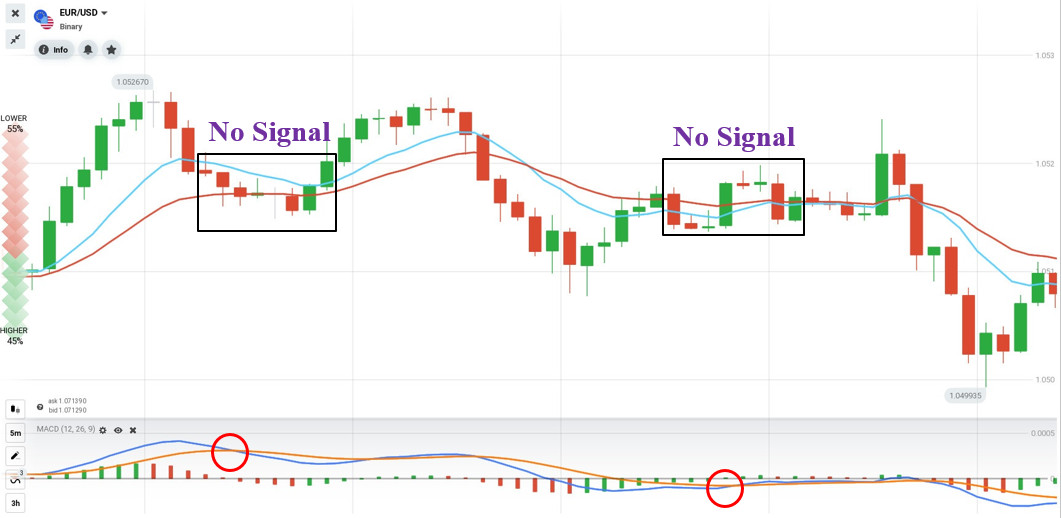
In the chart above, the MACD gives a sell signal while the 2 EMAs have no clear signal. If you open a DOWN order on MACD’s signal, then you will lose in this trade. Next is another buy signal from the MACD but the 2 EMAs have no signal yet. If you open an UP order, you will lose, unfortunately.
So should we use a leading or lagging indicator in IQ Option trading?
To use the leading or lagging indicator or both of them most efficiently, you need to determine which market you are in and whether the main trading timeframe is short or long.
If you’re trading options, it’s a good idea to use leading indicators to catch the opportunities from trend reversals.
If you are trading Forex, then the lagging indicator will help you to catch a large bullish or bearish wave.
Each indicator will have a different perspective. Thus, you need to practice to have the best experience. Then choose the right indicator in each market state to have the opportunity to bring profits to your account. Remember if the signals don’t agree and contradict each other, staying out of the market is the best solution.
Register IQ Option and Get Free $10,000 Risk warning: Your capital might be at risk.
Indonesia Português Tiếng Việt ไทย العربية हिन्दी 简体中文 Nederlands Français Deutsch हिन्दी Italiano 한국어 Melayu Norsk bokmål Русский Español Svenska Tamil Türkçe Zulu


