
 Indonesia
  Português
  Tiếng Việt
  ไทย
ไทย  العربية
  हिन्दी
  简体中文
简体中文  Nederlands
  Français
  Deutsch
  हिन्दी
  Italiano
  한국어
한국어  Melayu
  Norsk bokmål
  Русский
  Español
  Svenska
  Tamil
Tamil  Türkçe
  Zulu
Zulu
After reading 5 articles, we have completed the warm-up of the Price Action series in IQ Option. You can review the full 5 parts below
What is Price Action trading strategy? Where does its origin come from? – Part 1
Price Action Basics For Beginners – Part 2
Popular Price Action Trading Strategy – Part 3
Why new traders should start trading with Price Action – Part 4
5 Steps to becoming a Price Action Trader – Part 5
Now let’s go to the “acceleration” part after the warm-up is done. This is a section dedicated to the tools that Price Action traders will use. In this section, we will in turn learn how to use the simple tools of each candlestick such as support, resistance, trendline, price channel to read and understand Price Action.
I hope by the end of this section everyone has perfected their skills in reading Price Action and using the tools above. And the most important thing is understanding the story the market wants to tell you when looking at the Japanese candlestick chart.
Register IQ Option and Get Free $10,000 Risk warning: Your capital might be at risk.
What is the price action of each Japanese candlestick?
Reading the price action of each candlestick means understanding what the market has done now and what it is preparing to do in the future. In this way, we can increase the probability of correctly guessing what it will do.
A lot of traders try to use candlestick patterns to read price action. Its problem is that they are attached too much to cumbersome names that are difficult to remember, tend to find candles that match the theory mechanically. Reading and understanding Price Action must be gentle and easy to understand, not rote learning.
After this article, you will understand how easy it is to read and understand Price Action.
How to read and understand Japanese candlesticks
A candlestick represents price data for a fixed period of time. I am sure many of you already know this.
We need 4 pieces of information to analyze the formation of a candle
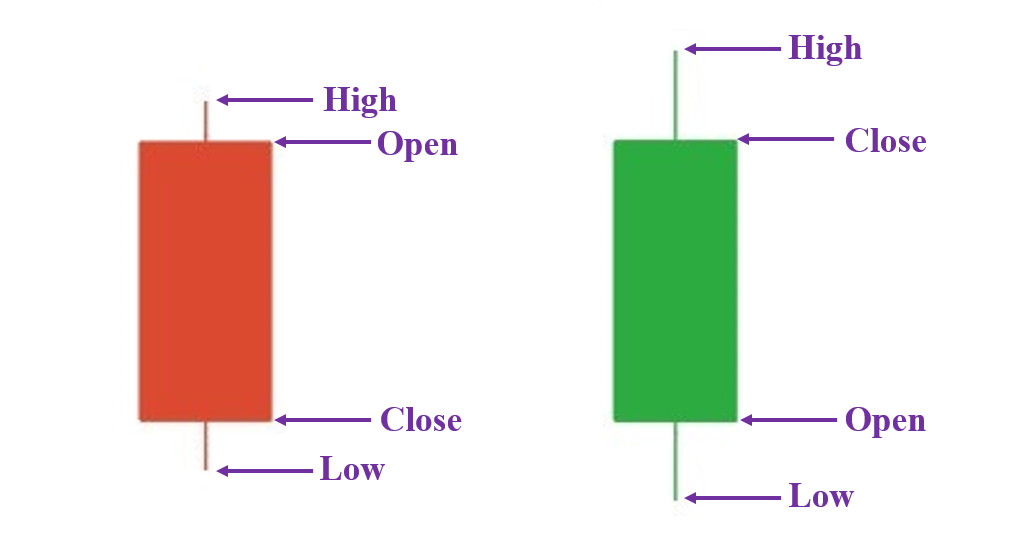
- Open price (Open – O)
- Highest price (High – H)
- Lowest price (Low – L)
- Close price (Close – C)
OHLC is 4 basic information of a candlestick. These 4 pieces of information give us important data to read the price action that took place during the creation of that candle.
- Candlestick length (range)
- Candlestick body
- Upper shadow (upper wick/tail)
- Lower shadow (lower wick/tail)
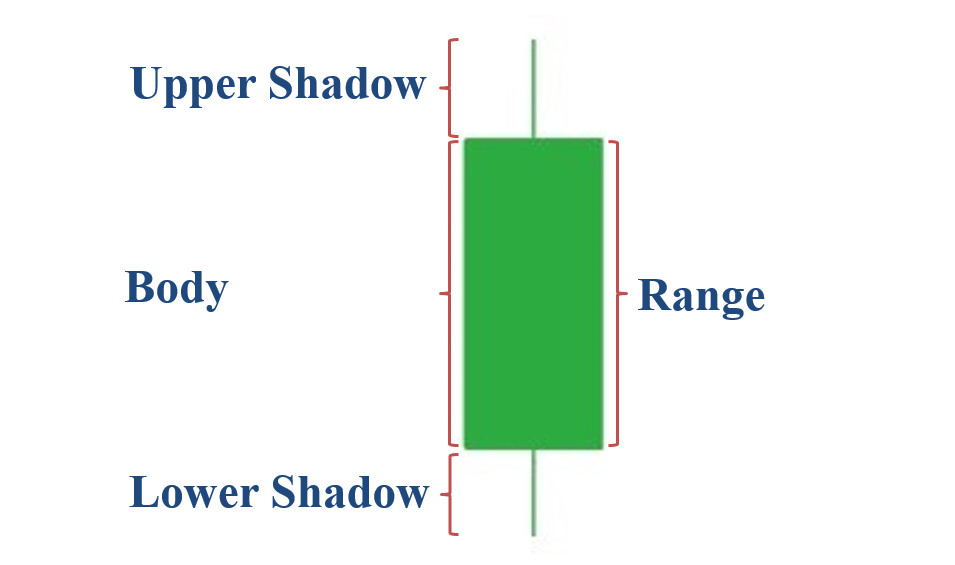
The length of the candlestick (range)
The range shows us how volatile the market was during the creation time of a candlestick. The longer the candle, the more volatile the market. The shorter the candle, the quieter the market.
Speaking of which, if you are using the Bollinger Bands indicator to measure the volatility of the market, now you can remove it. Because the candle already tells you what state the market is in. There is no need to ask for the help of any Indicator.
Candlestick body
The real body of the candlestick is where the dispute between the bulls and the bears takes place. It tells us who is winning, or drawing. The real body shows how strong that candle is.
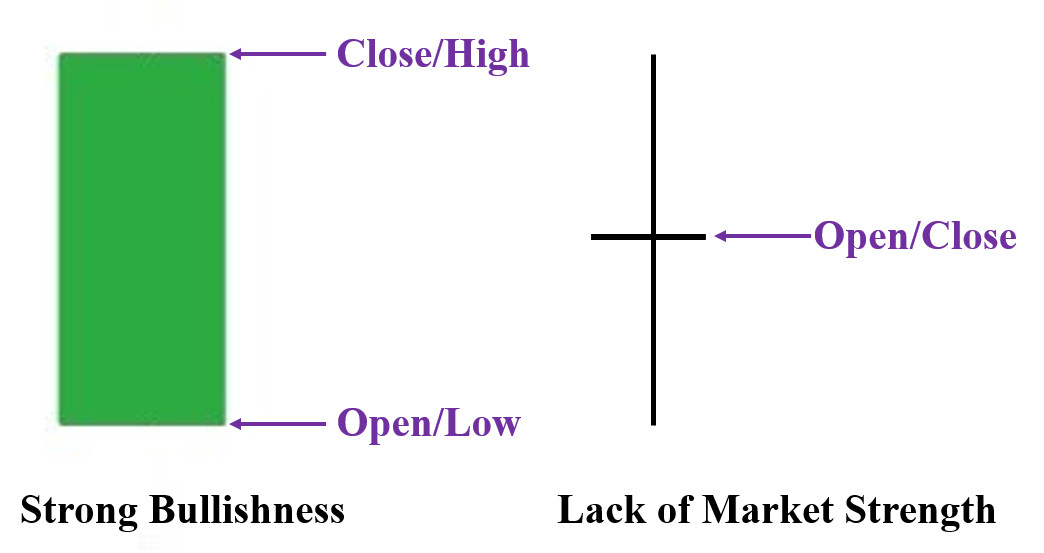
If the candle closes higher than the open (green color), then you don’t need to care what happened during that time. You just need to know that the bulls are winning as a result. In contrast to the bearish candle (red color), the bears are in control of the market.
The bullish candle has a longer body, which means that the strength of the bulls outweighs the bears. Conversely, the longer the bearish candle, the bears are outpacing the bulls.
If the closing price is (nearly) equal to the opening price, this is a draw. The market simply hasn’t decided where it’s going. This is called a Doji candle, shaped like a plus sign (+) as shown above. Practice reading and understanding the meanings of candles instead of lengthy names.
After looking at a candle, you have to answer 2 questions.
- Is the market going up or down?
- Is that increase or decrease strong?
Upper shadow
The upper shadow represents the segment where the market has been up, but cannot break through that price zone. Because at that price, more sellers push the market down.
The upper shadow represents SELL FORCE. The longer the upper shadow, the stronger the selling force for the length of time the candle lasts.
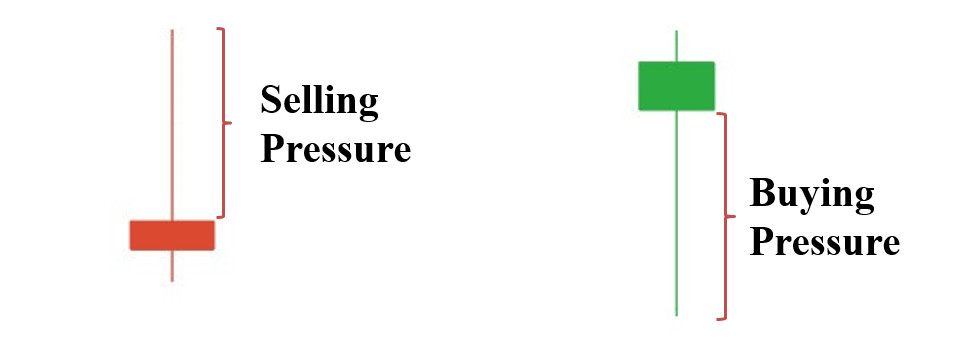
Lower shadow
In contrast to the upper shadow, the lower shadow is the part of the market that has dropped, but cannot go lower. Simply put, there is buying power in that price zone pushing the price up. The longer the lower shadow, the stronger the buying power.
The upper and lower shadows of the candle are an important premise of the two concepts of price acceptance and rejection. The short shadow shows that the price has accepted to rise or fall. The long shadow represents a price refusal to move up, or a refusal to fall.
Through this article, you have somewhat understood how to read the price action of each Japanese candle. From there, you can give or wait for the next data to enter the order. Let’s get used to observing the candles and understand the messages they want to convey to help your predictions.
Register IQ Option and Get Free $10,000 Risk warning: Your capital might be at risk.
Indonesia Português Tiếng Việt ไทย العربية हिन्दी 简体中文 Nederlands Français Deutsch हिन्दी Italiano 한국어 Melayu Norsk bokmål Русский Español Svenska Tamil Türkçe Zulu


