
 Indonesia
  Português
  Tiếng Việt
  ไทย
ไทย  العربية
  हिन्दी
  简体中文
简体中文  Nederlands
  Français
  Deutsch
  हिन्दी
  Italiano
  한국어
한국어  Melayu
  Norsk bokmål
  Русский
  Español
  Svenska
  Tamil
Tamil  Türkçe
  Zulu
Zulu
In the previous post, I introduced what Price Action is and its origin. To continue the series, I will show you the most basic concepts of Price Action for beginners.
Register IQ Option and Get Free $10,000 Risk warning: Your capital might be at risk.
Price Action concept of candlestick pattern
After Steve Nison introduced the Japanese candlestick pattern to the world, short-term price movements called patterns began to become more common. Since then, candlestick patterns have become the most important analysis method of modern price action.
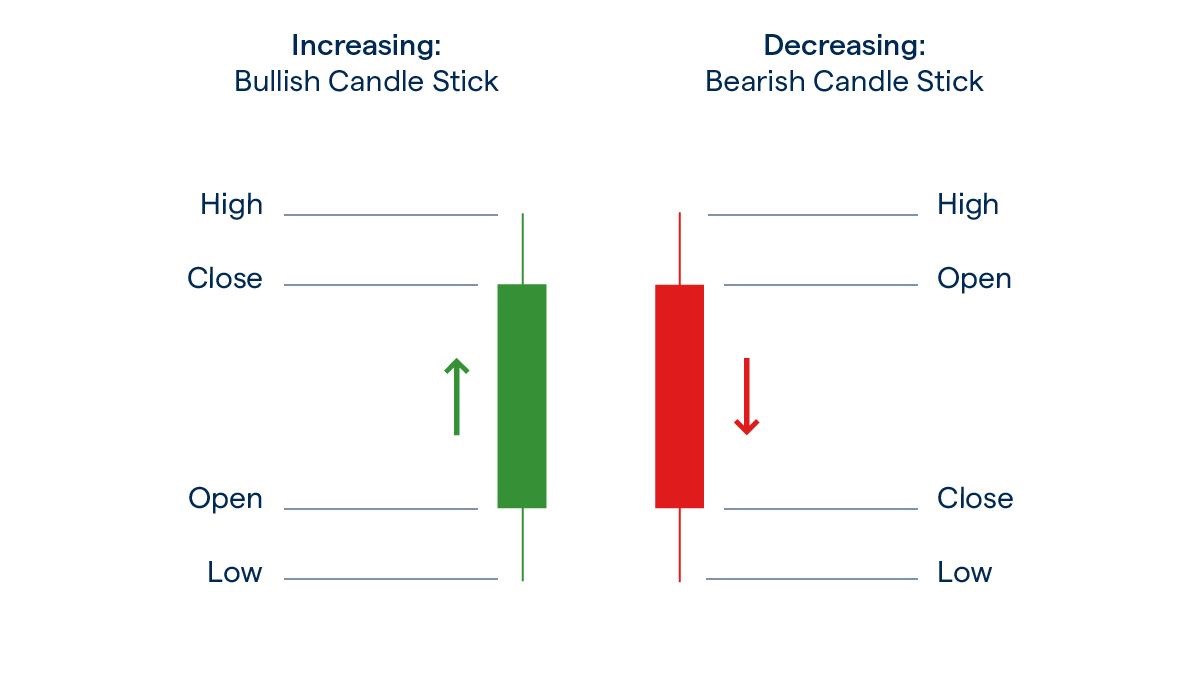
A candlestick is simple but hidden in it is a lot of useful information. The upper and lower part of a candlestick (called shadow or wick) will show us the selling and buying forces. Meanwhile, the real body shows the current market sentiment.
In the simplest terms, if the candlestick closes higher than the previous one, the market is bullish. Otherwise, it is bearish.
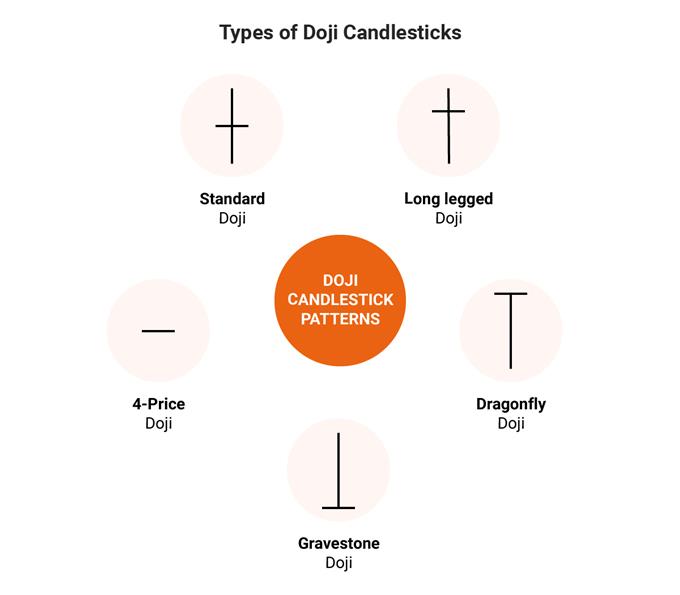
If the closing price is equal to the opening price (almost no real body), the psychology of the bulls and bears are in equilibrium for the time being. This candlestick is called a Doji.
The distance between the top and the trough of a candlestick shows the volatility during that trading session. Therefore, the longer the candlestick, the more volatile the market is. It shows us that the war between Bulls (buyers) and Bears (sells) is taking place extremely tense and fierce.
If you understand the story that a candlestick wants to tell, then you could also understand the story of the market.
Analyze each fundamental candlestick
To understand the market, reading one candlestick is still not enough. Traders must know how to read each candle and then put the pieces together into a story. That’s called bar by bar analysis.
When looking at a cluster of candles on the chart, experienced traders will immediately see the story they want to tell. A battle between the Bulls and the Bears is clearly shown on the screen. Which side wins or which side loses is fought is described in the most detail. There is no need for technical indicators, as prices and candlesticks themselves are very informative.
Price Action is applicable on which markets?
You can use it on all markets. Because of its simple nature, only the price and candlesticks are needed as information.
The more liquid the market, the stronger Price Action will be. The candlesticks will also tell you stories with high accuracy to help you easily predict the price shortly.
Important fundamentals in Price Action
Price pattern
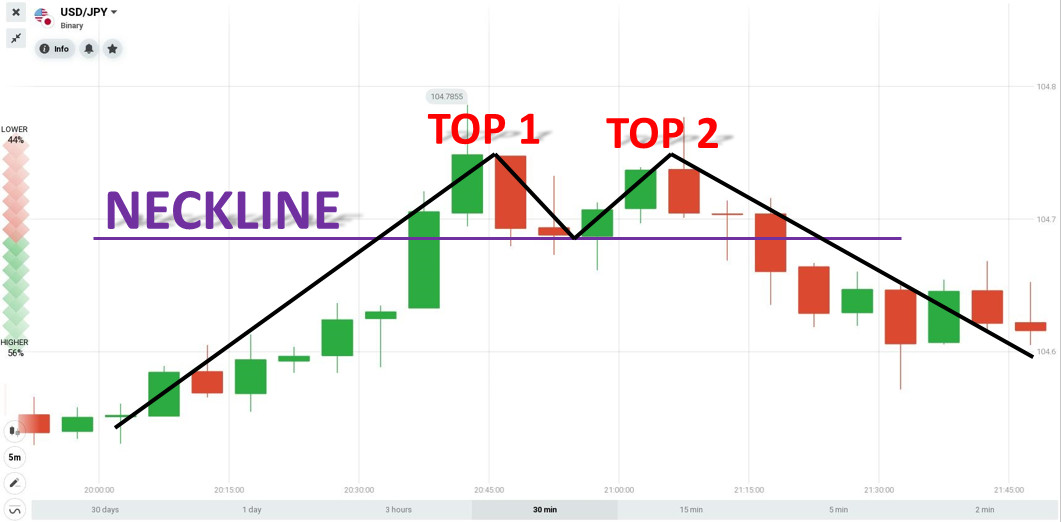
In Price Action, we often use classical price patterns as a basis for analysis.
You will often encounter simple price patterns such as Double Top, Double Bottom, Head and Shoulders, etc. So you should learn these basic patterns to use them better.
Trends and reversal points
The market does not move randomly. It follows one of three trends including uptrend, downtrend, and sideways. You must understand the trend and the reversal points such as Swing High and Swing Low – to be able to analyze Price Action.
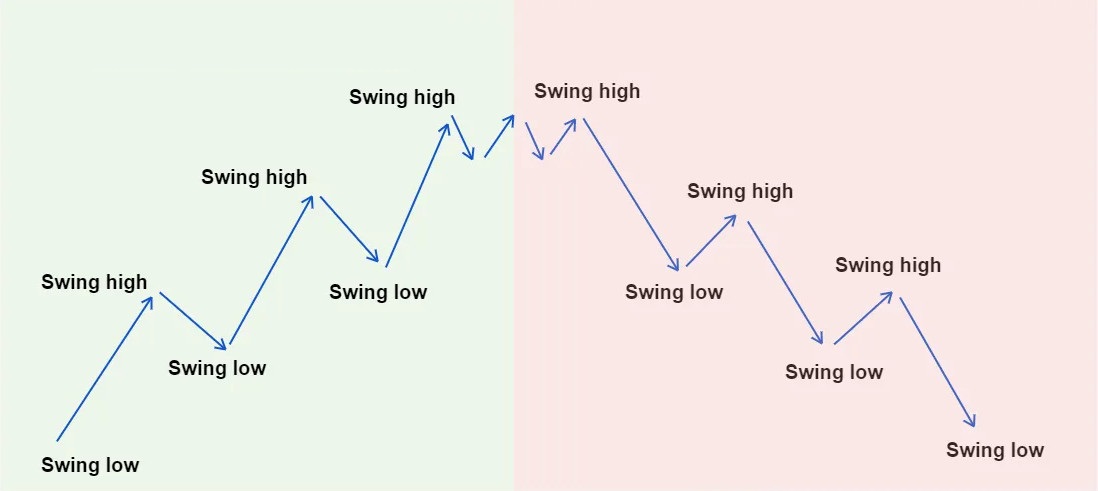
Note: An uptrend is broken when the price breaks down to the nearest Swing Low. A downtrend is broken when the price breaks above the nearest swing high.
Support and resistance
These are extremely important concepts in Price Action. We will enter orders according to support and resistance zones to have a higher winning rate.
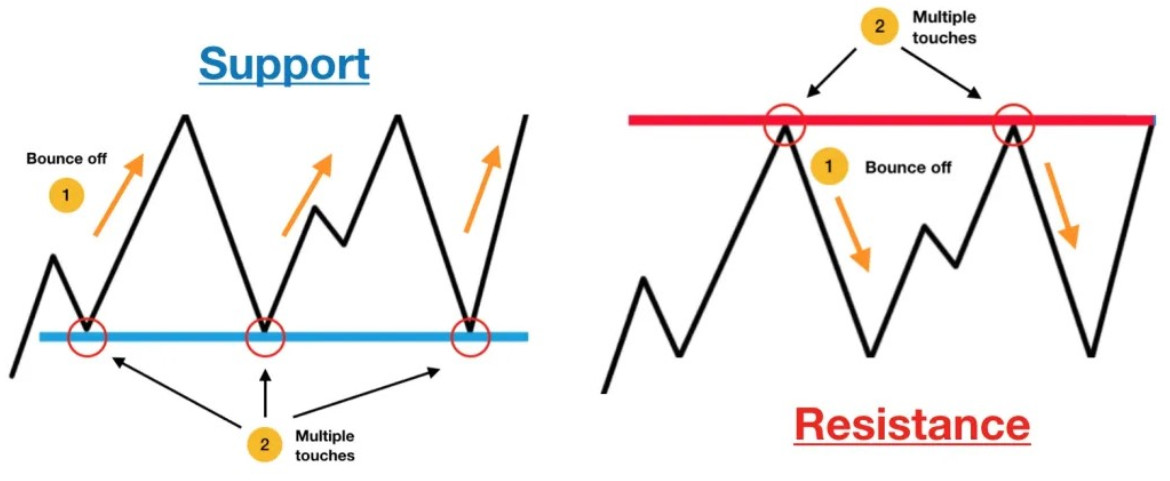
Price Action trading is successful or not depends on whether you can determine the support and resistance correctly or not.
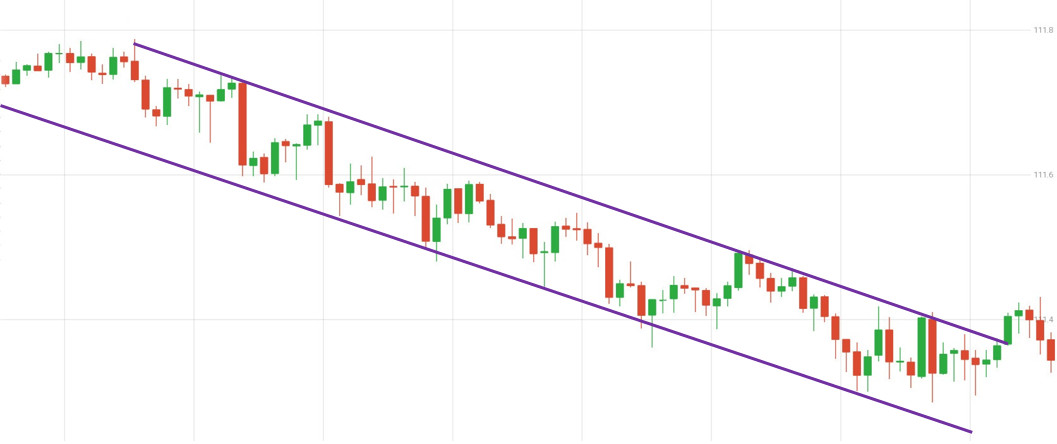
Trendline and price channel
Trendline and price channel are very beautiful movements of the market following the direction of the trend. However, because they are diagonal levels (compared to horizontal levels), they will not be as reliable as support and resistance. We still use them, but for reference purposes only.
Summary
The basics are something you need to know before diving into the Price Action trading strategy. It will take a lot of time for you to learn and ponder them.
Let’s learn and master the foundation before building yourself a perfect Price Action trading strategy.
Register IQ Option and Get Free $10,000 Risk warning: Your capital might be at risk.
Indonesia Português Tiếng Việt ไทย العربية हिन्दी 简体中文 Nederlands Français Deutsch हिन्दी Italiano 한국어 Melayu Norsk bokmål Русский Español Svenska Tamil Türkçe Zulu


