
 Indonesia
  Português
  Tiếng Việt
  ไทย
ไทย  العربية
  हिन्दी
  简体中文
简体中文  Nederlands
  Français
  Deutsch
  हिन्दी
  Italiano
  한국어
한국어  Melayu
  Norsk bokmål
  Русский
  Español
  Svenska
  Tamil
Tamil  Türkçe
  Zulu
Zulu
The strategy with the Parabolic Sar indicator combined with the resistance and support to find entry points has an amazingly high winning rate. In this article, I will share my entry points for you to view and evaluate this trading method that brings 35.6% of the profit on January 13, 2020 in IQ Opion is worth using or not.
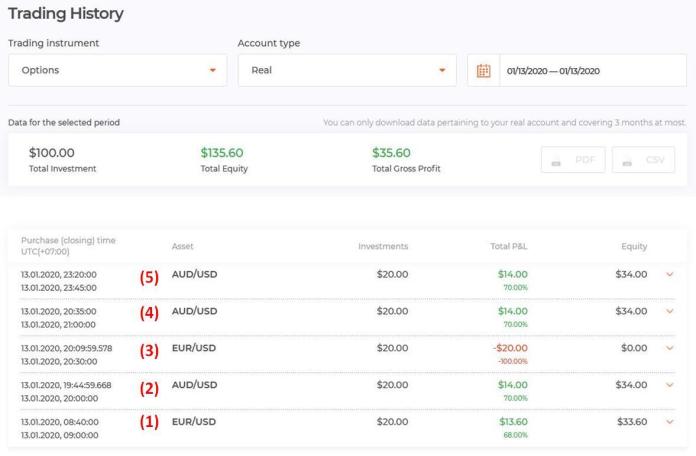
All of the 5 options I traded have one thing in common. That is to open HIGHER options when the price touches the support zone in an uptrend.
There is no LOWER option to share with you guys because I prioritize my main job (Office worker). My free time to observe the chart is usually from 17:00 to 23:30 in the day. Unfortunately on Jan 13 2020, the currency pairs I observe follow the uptrend, which leads to no LOWER options.
When the market trend is up, I have no other choice but to follow it and buy HIGHER options. Because they have a high potential winning rate. So about LOWER options, I will share in another article in the near future.
Register IQ Option and Get Free $10,000 Risk warning: Your capital might be at risk.
Trading strategy with Parabolic Sar indicator combined with Support
Below are the conditions for entering options when using the Parabolic Sar indicator trading strategy.
Trend
What every investor knows that they only trade when the market has clearly shown the trend. So I will only guide trading with an upward or downward trend. I don’t encourage you to trade when the market is sideways.
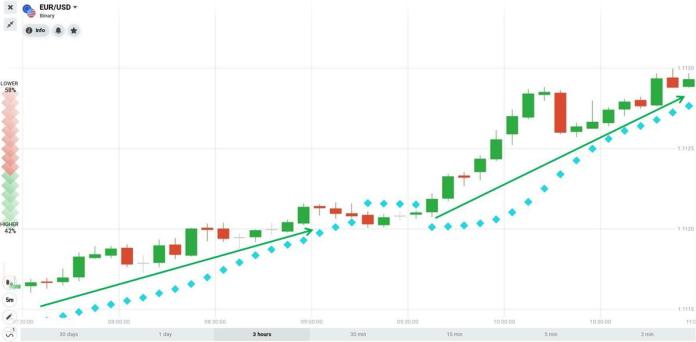
Uptrend: Parabolic Sar indicator is moving up from the bottom. The next peaks are higher than the previous ones. The same goes for the bottoms.
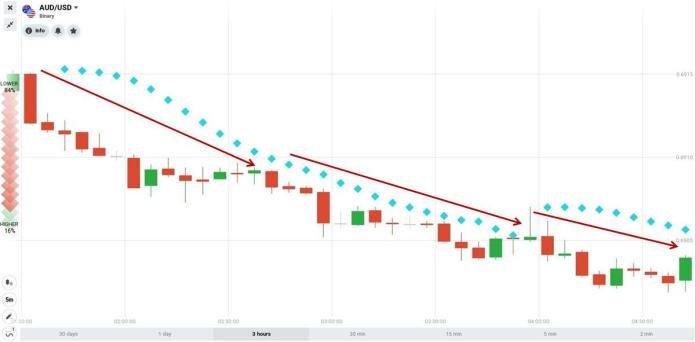
Downtrend: Parabolic Sar indicator is falling down from the top. The next bottoms are lower than the previous ones. The tops are just like the bottoms.
Resistance and support
When the trend is up, the best entry point is when the price adjusts to the support zone which has just formed combining with the Parabolic Sar indicator moving up from the bottom.
When the trend is down, the entry point that has the highest winning rate is at the resistance level the price has just passed combining with the Parabolic Sar indicator is moving down.
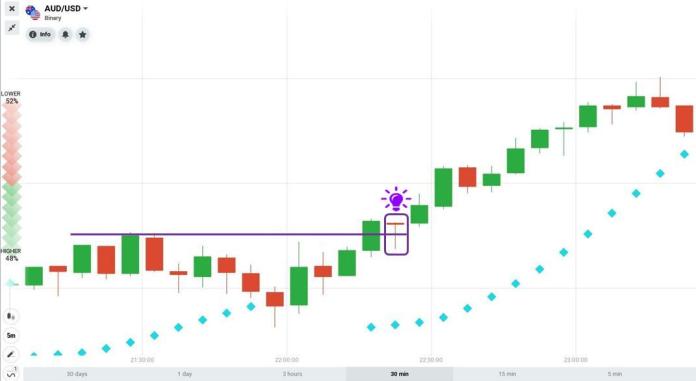
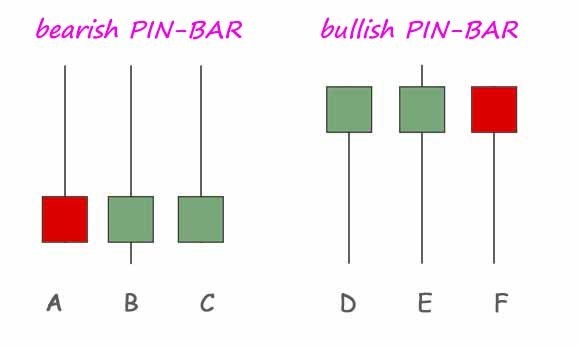
Signal candlestick
The signal is a candlestick with a long tail that touches the resistance or support zone, which shows that the price has been denied by the market. This candlestick is usually Doji or Pinbar.
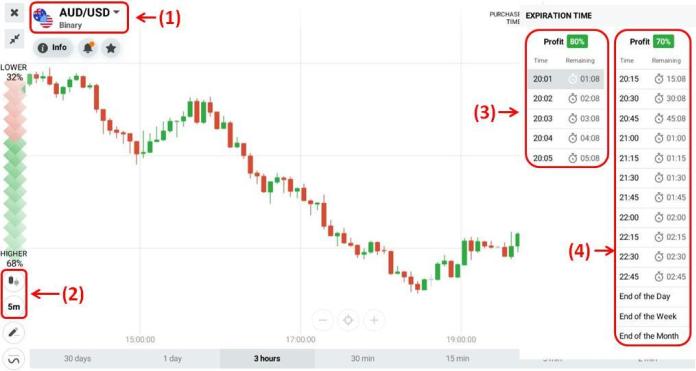
Steps to prepare before trading with Parabolic Sar indicator and Support
(1) Currency pair: AUD/USD, EUR/USD.
(2) Japanese candlestick chart. The candle time period is 5 minutes
(3) The expiration time from 1 to 5 minutes is not encouraged.
(4) The reasonable expiration time is 15 minutes or more.
How to trade
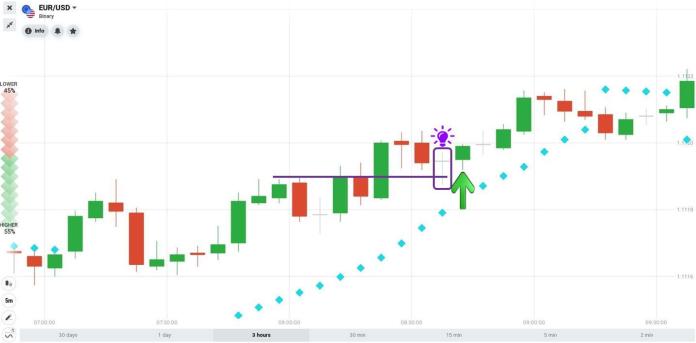
HIGHER = Uptrend + the price tests the support level + Parabolic Sar indicator is moving up from the bottom.
LOWER = downtrend + the price tests the resistance + Parabolic Sar indicator is moving down from the top.
Classic capital management strategy: $20 per option, up to 5 options a day.
Profit: 35.6%.
Entry points on January 13, 2020 with Parabolic Sar indicator strategy combining with Support
Signal entry in IQ Option
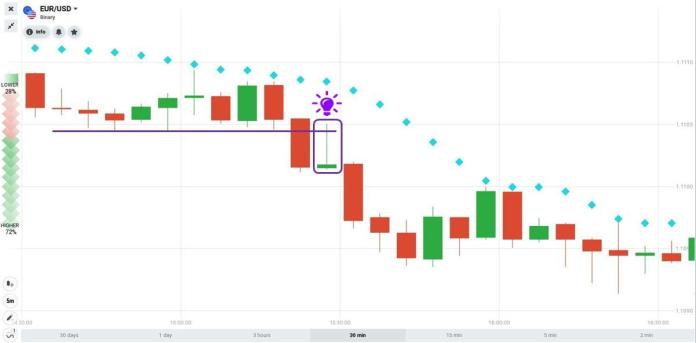
Option 1: Uptrend + the price tests the support level + Doji candlestick = Open a HIGHER option.
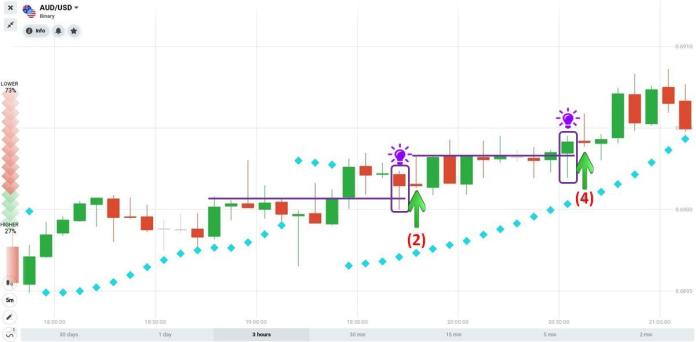
Option 2: Uptrend + the price tests the support level + Pinbar candlestick = Open a HIGHER option.
Option 4: Uptrend + the price tests the support level + Pinbar candlestick = Enter a HIGHER option.
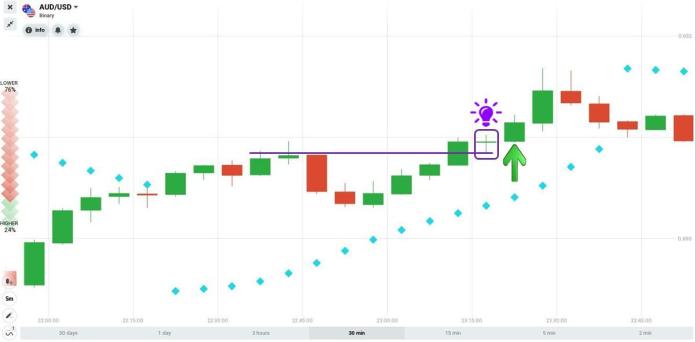
Option 3: Uptrend + the price tests the support level + = Enter a HIGHER option.
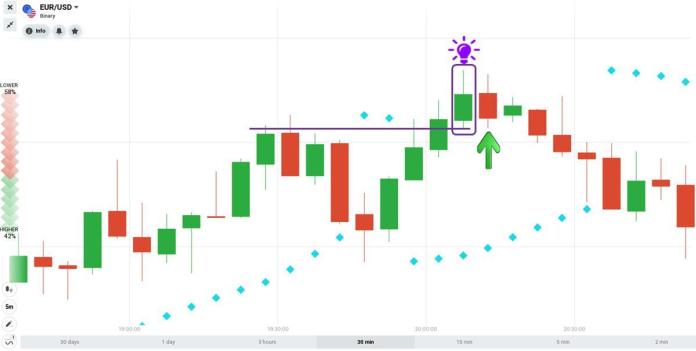
Option 5: Uptrend + the price tests the support level + Doji candlestick = Open a HIGHER option.
These indicators give us an objective view of the market. To be confident in each entry point, we should combine the types of indicators that support each other to form the strategy that suits yourself best.
Do not use a single indicator because sometimes it does not provide the exact data that you want to find out. The market always has the ability to create very large fluctuations that make the indicators not work as expected. At that time, combining indicators will show us the signal to stop trading.
Summary
I share this article because I want to learn more from you. To win in this market, you have to learn new knowledge about it every day. I was lucky to have a good starting point so I could go faster and write good entry points that I had been through. From there, I want to learn together to improve our knowledge so that we can make a profit in this fierce financial market.
If you are lacking one of the two things that are patience and discipline, I advise you to practice more until you have better control of yourself. After that, it’s time to think about achieving the desired profit by trading in IQ Option.
Register IQ Option and Get Free $10,000 Risk warning: Your capital might be at risk.
Indonesia Português Tiếng Việt ไทย العربية हिन्दी 简体中文 Nederlands Français Deutsch हिन्दी Italiano 한국어 Melayu Norsk bokmål Русский Español Svenska Tamil Türkçe Zulu


