 Indonesia
  Português
  Tiếng Việt
  ไทย
ไทย  العربية
  हिन्दी
  简体中文
简体中文  Nederlands
  Français
  Deutsch
  हिन्दी
  Italiano
  한국어
한국어  Melayu
  Norsk bokmål
  Русский
  Español
  Svenska
  Tamil
Tamil  Türkçe
  Zulu
Zulu
Weis Wave Volume (WWV) is not a popular indicator in IQ Option. But it is widely used by Brazillian traders. This indicator is used to find the main trend of the market. At the same time, it also gives you reliable signs to buy long-time options in IQ Option.
In this article, I will show you how to set up and find the trend of the market as well as open options in IQ Option using Weis Wave Volume.
Register IQ Option and Get Free $10,000 Risk warning: Your capital might be at risk.
What is Weis Wave Volume?
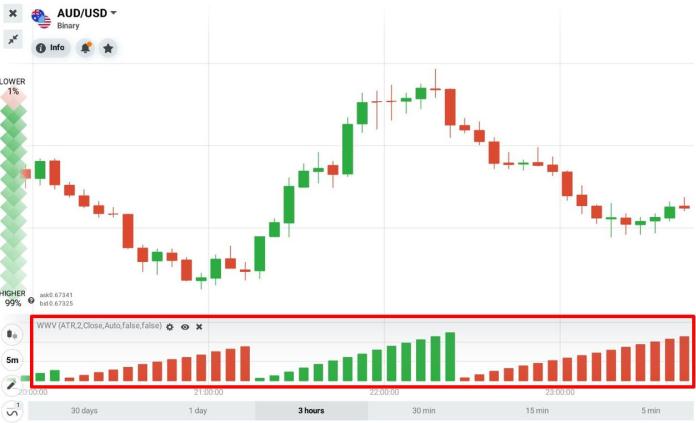
Weis Wave Volume is the indicator built from the current market trend. When the price develops a new trend, the scale of WWV becomes larger.
Weis Wave Volume – How does it work?
In IQ Option, Weis Wave Volume has 2 main colors including green and red.
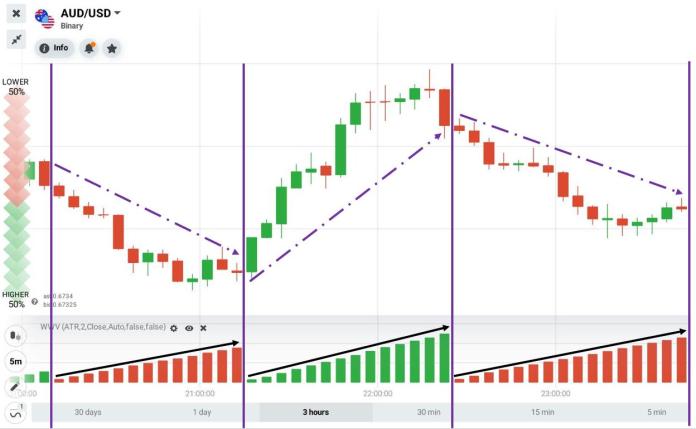
• Green color indicates the increasing wave. When the market follows an upward trend, the green volume also increases (Green WWV rises).
• Red color indicates the decreasing wave. When the market follows a downward trend, the red volume also increase (Red WWV rises)
Therefore, professional traders use WWV to confirm the current trend in the market.
How to set up Weis Wave Volume in IQ Option
You can use Weis Wave Volume in many kinds of chart namely Line chart, candlestick chart, bar chart or even Heiken Ashi candlestick chart.
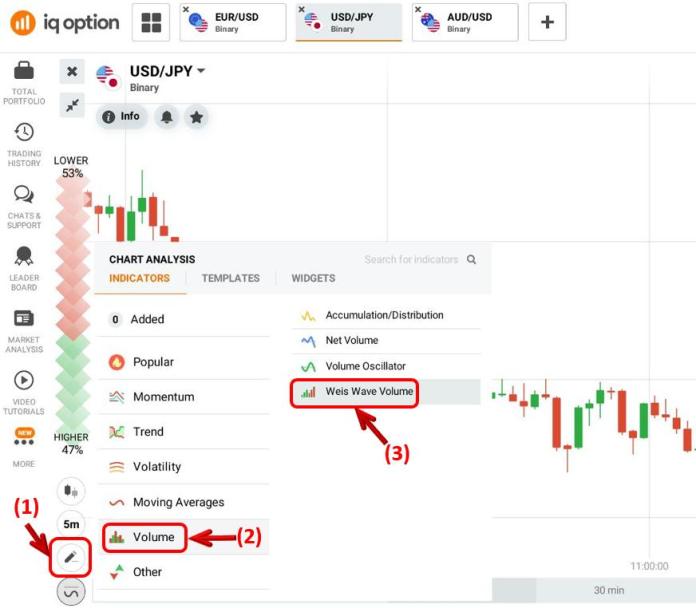
How to set up WWV. (1) Click Indicator=> (2) Choose Tab Volume => (3) Choose Weis Wave Volume.
You do not need to change the indexes of WWV in IQ Option.
How to trade with Weis Wave Volume in IQ Option
As WWV is a trend indicator, you should open long-time options (from 15 minutes) in IQ Option when using this indicator.
Long-time option means opening an option with expiration time more than 15 minutes when you observe a 5-minute candlestick chart.
There are many strategies to open options in IQ Option using WWV.
In combination with Heiken Ashi candlestick chart
Heiken Ashi is a kind of candlestick chart that reveals the trend in the market. When using it with WWV, you will have reliable entry points for buying options.
Requirement: 5-minute Heiken Ashi candlestick chart + WWV. Expiration time from 15 minutes.
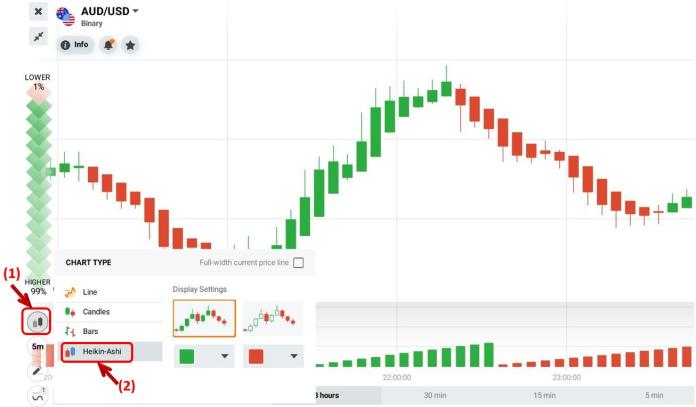
How to buy an option:
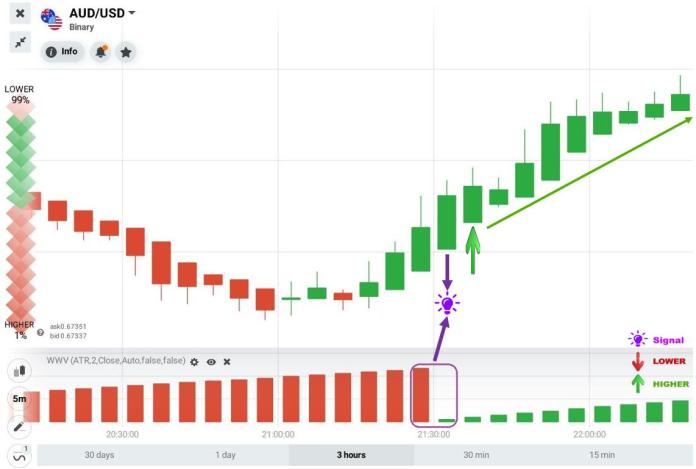
• Buy HIGHER options when WWV turn from red to green + Heiken Ashi candlestick chart shows green color.
Explanation: When the Heiken Ashi candlestick chart shows green color, it indicates that the market is following an uptrend at that time. At the same time, WWV changes the color from red to green => Confirm that the price trend changes from downtrend to uptrend.
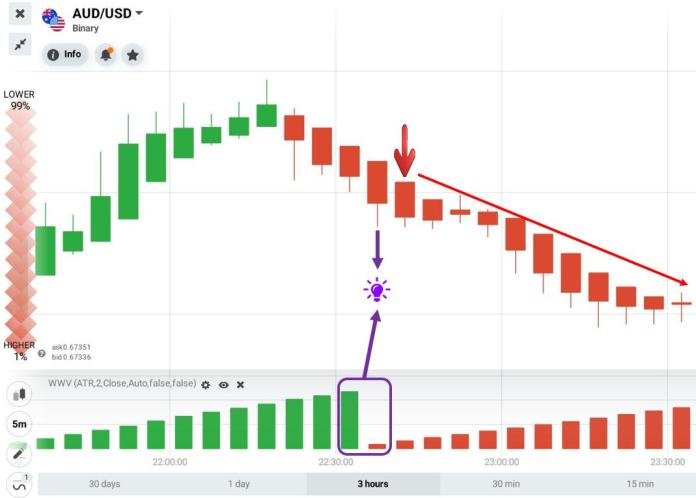
• Buy LOWER options when Weis Wave turns from green to red+ Heiken Ashi candlestick chart shows red color.
In combination with Japanese candlestick chart + SMA
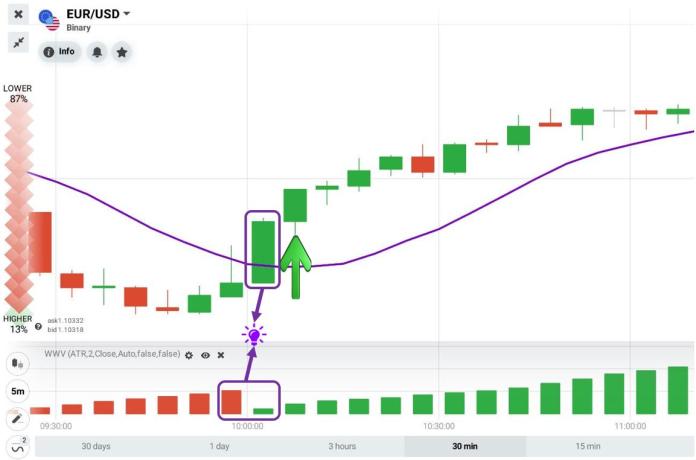
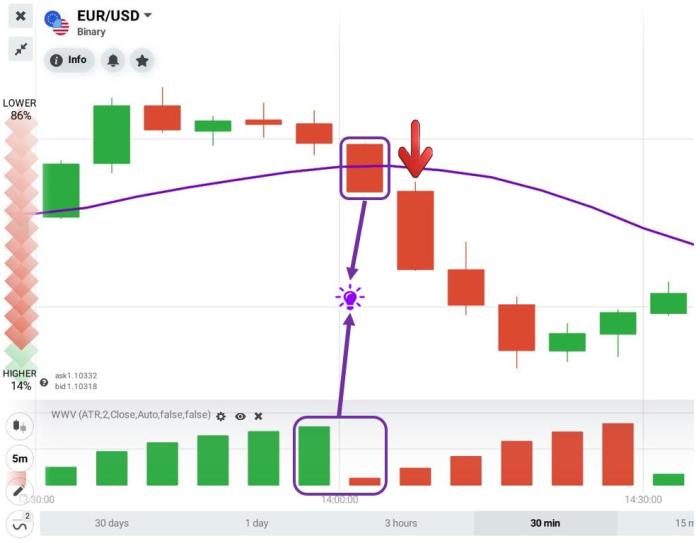
SMA is a very good indicator that signifies the trends clearly. When using it in combination with Weis Wave, you will have very reliable points for opening options.
Requirement: 5-minute Japanese candlestick chart, SMA10 (or SMA30) indicator + Weis Wave indicator. Expiration time: 15 minutes.
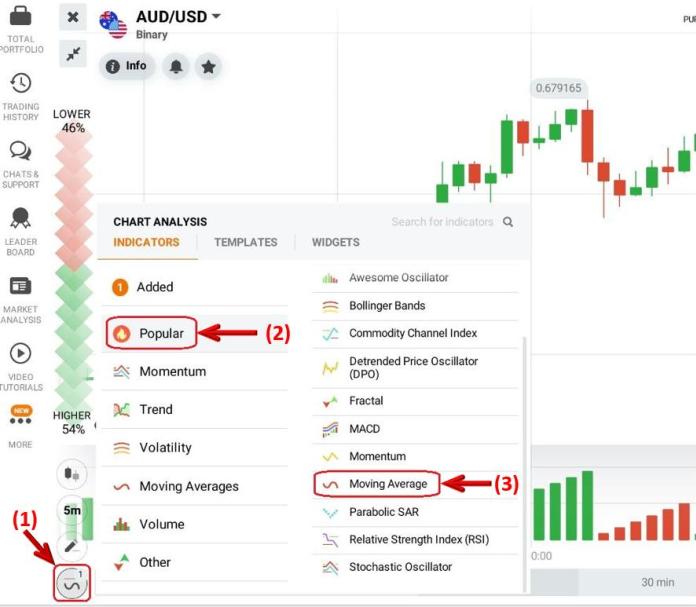
How to buy an option:
• Buy HIGHER options when the price cuts the SMA10 line from under the SMA10 line + Weis Wave indicator changes from red to green.
• Buy LOWER options when the price cuts the SMA10 line from above the SMA10 line + Weis Wave indicator changes from green to red.
There are many strategies with Weis Wave Volume. I will write more detailed articles about those strategies in IQ Option.
Goodbye!
Register IQ Option and Get Free $10,000 Risk warning: Your capital might be at risk.
 Indonesia
  Português
  Tiếng Việt
  ไทย
ไทย  العربية
  हिन्दी
  简体中文
简体中文  Nederlands
  Français
  Deutsch
  हिन्दी
  Italiano
  한국어
한국어  Melayu
  Norsk bokmål
  Русский
  Español
  Svenska
  Tamil
Tamil  Türkçe
  Zulu
Zulu
