
 Indonesia
  Português
  Tiếng Việt
  ไทย
ไทย  العربية
  हिन्दी
  简体中文
简体中文  Nederlands
  Français
  Deutsch
  हिन्दी
  Italiano
  한국어
한국어  Melayu
  Norsk bokmål
  Русский
  Español
  Svenska
  Tamil
Tamil  Türkçe
  Zulu
Zulu
In trading options, there are many types of moving averages. Today, we will introduce you to EMA – a moving average that is commonly used in IQ Option. You can use it to trade short or long-term. In this article, we analysis deeply to come up with an effective strategy around this MA.
Register IQ Option and Get Free $10,000 Risk warning: Your capital might be at risk.
What is EMA indicator?
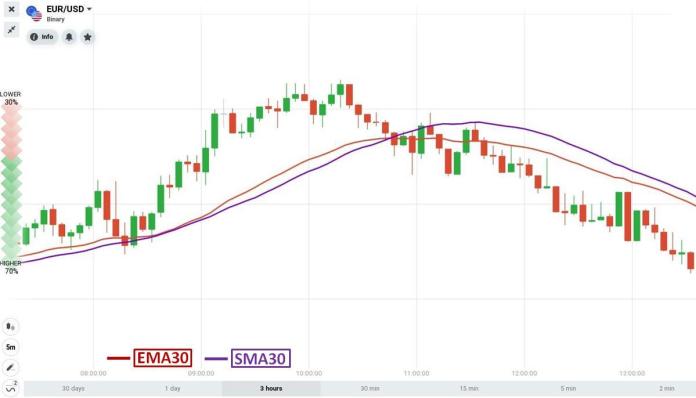
EMA is an exponential moving average that is calculated using an exponential formula. In particular, the recent price movements and fluctuations are focused. Thus, EMA is quite sensitive to short-term price movements. It helps you identify reversal signals faster than the SMA.
How does EMA indicator work?
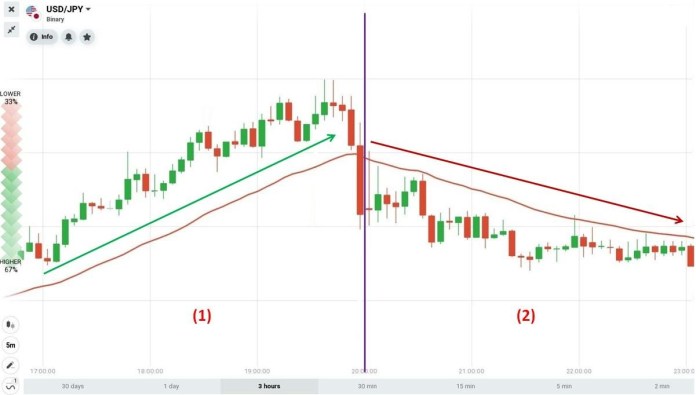
EMA is a better trend-trading tool because it gives a higher score on the most recent data and changes that catch up with the trend quickly.
A short time period will make EMA sensitive to price fluctuation. If catching the trend is EMA advantage, the downside is that it does not filter out the noise signals.
(1) When the price is above EMA => the market tends to increase.
(2) When the price is below EMA => the market tends to decrease.
Note: The price keeps crossing EMA in a certain channel => The market tends to move sideways.
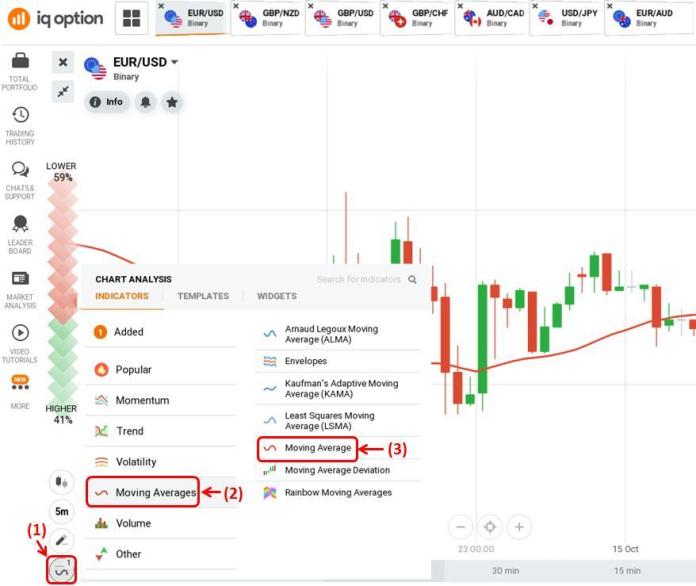
How to set up EMA in IQ Option
To set up EMA: (1) Click the indicator box => (2) Moving Averages tab => (3) Select Moving Average.
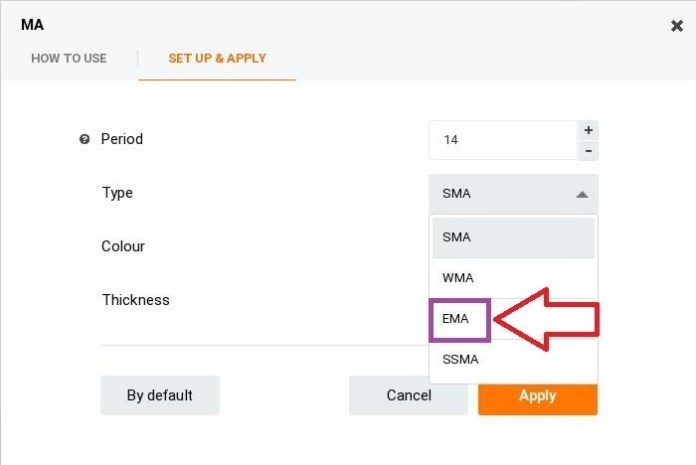
Then select EMA as shown in the picture below. The default of IQ Option is 14 but we can customize it freely.
How to trade options with EMA indicator in IQ Option
EMA is strong in identifying and confirming trends. We just need to follow the trend to find a safe entry point.
Strategy 1: EMA indicator combines with Heiken Ashi candlestick chart
Heiken Ashi candlestick chart and trend indicators like EMA will give entry points with a high winning rate.
Requirements: 5-minute Heiken Ashi candlestick chart + EMA30 indicator. The expiration time is 15 minutes or more.
Trading strategy:
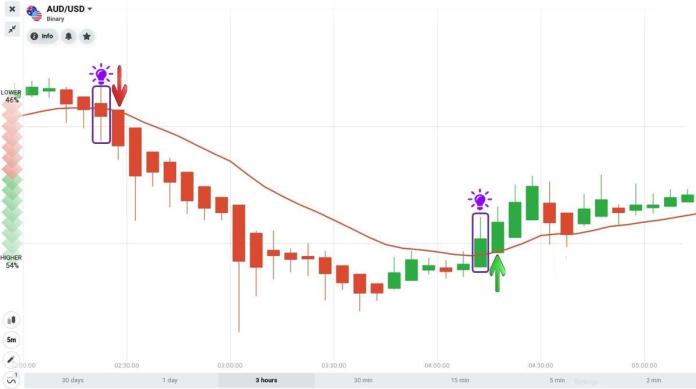
HIGHER = Heiken Ashi is in the green candlestick series (uptrend) + The price moves up and cuts EMA30 from below.
LOWER = Heiken Ashi is in the red candlestick series (downtrend) + The price moves down and cuts EMA30 from above.
Strategy 2: EMA works with reversal candlestick patterns
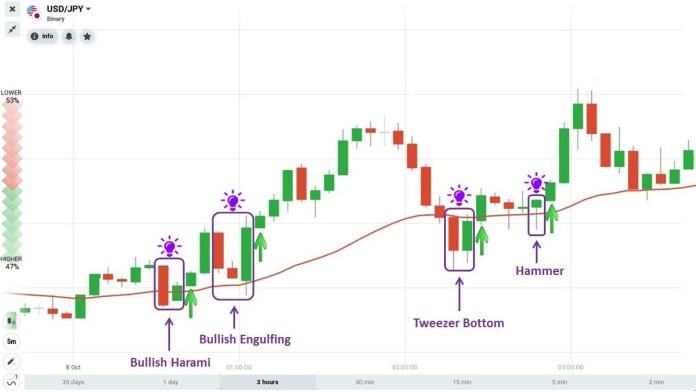
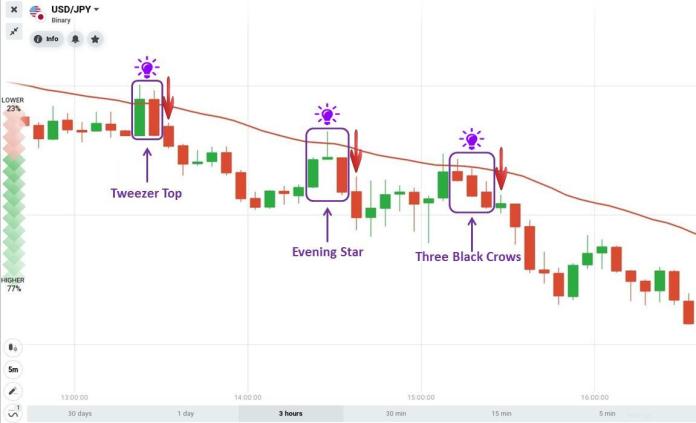
EMA30 is a mid-term trend line when candlestick patterns appear right at the crossroads between EMA30 and the price. You can buy options with a short expiration time.
Requirements: Japanese 5-minute candlestick pattern + EMA30 indicator. The expiration time is from 5 to 10 minutes.
Trading strategy:
HIGHER = The price is above EMA30 (uptrend) and crosses EMA30 + bullish candlestick pattern (Bullish Harami, Bullish Engulfing, Tweezer Bottom, Hammer …)
LOWER = Price is below EMA30 (downtrend) and cuts EMA30 + bearish candlestick pattern (Tweezer Top, Evening Star, Three Black Crows …)
Next time, we will update more safe and effective ways to trade around EMA in strategy articles. Hope you find this helpful. Thank you for reading.
Register IQ Option and Get Free $10,000 Risk warning: Your capital might be at risk.
Indonesia Português Tiếng Việt ไทย العربية हिन्दी 简体中文 Nederlands Français Deutsch हिन्दी Italiano 한국어 Melayu Norsk bokmål Русский Español Svenska Tamil Türkçe Zulu


