
 Indonesia
  Português
  Tiếng Việt
  ไทย
ไทย  العربية
  हिन्दी
  简体中文
简体中文  Nederlands
  Français
  Deutsch
  हिन्दी
  Italiano
  한국어
한국어  Melayu
  Norsk bokmål
  Русский
  Español
  Svenska
  Tamil
Tamil  Türkçe
  Zulu
Zulu
You are a crypto trader in IQ Option. Have you ever wondered if it is effective to apply the candlestick pattern to trading with cryptocurrencies? So what is the most effective trading strategy with cryptocurrencies for stable returns? This article will help you answer the above questions clearly with the breakout strategy. Let’s dig deeper into and analyze it.
Register IQ Option and Get Free $10,000 Risk warning: Your capital might be at risk.
When does a candlestick pattern work?
The majority of candlestick patterns give a great effect on forex currency pairs. It is when the price movements of a currency pair can be influenced by organizations and governments. So, we have the data to analyze and predict the price trend in the future specifically.
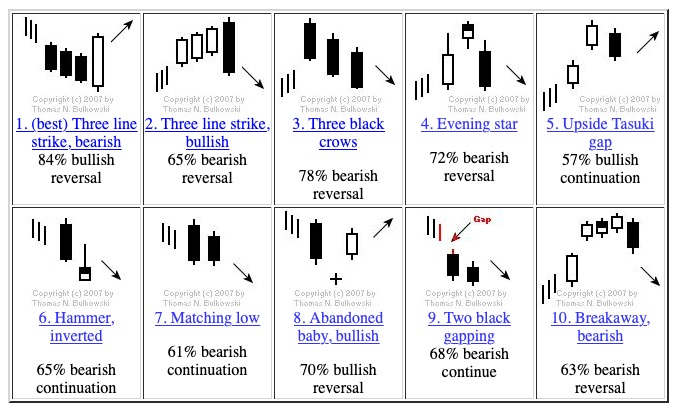
Every time a candlestick pattern appears on the price chart, experienced traders know what to do in the future to make a profit. They repeated in the past. So based on that statistics and analysis, it gives a suitable strategy for each type of separate candlestick pattern.
Is a candlestick pattern effective for Crypto (cryptocurrency)?
Crypto (cryptocurrency) is a new type. There is nothing that can influence it. So, prices do not follow a specific rule that makes predicting prices correctly not possible. And most candlestick patterns seem not to work for cryptocurrencies.

So are we just trading cryptocurrencies in IQ Option by chance? Luck is part of financial trading. However, what is needed to be successful is a good strategy. I will show you a pretty effective breakout trading strategy for crypto.
The breakout trading strategy
Breakout trading is one of the favorite strategies of crypto traders. However, it is not always favorable for us, or in other words, prices do not always break out as we wish. Therefore, to be precise, traders need to learn and study more about the breakout.
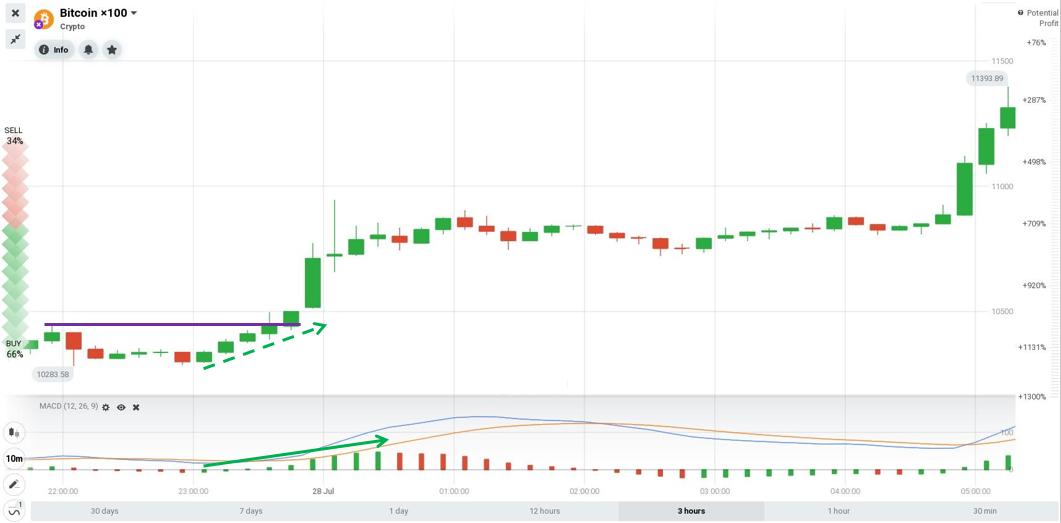
Wait for a large volume to confirm the price has broken out
There is no other tool that confirms a breakout better than volume, especially when it rockets.
Large volume represents the trading commitment of the market participants. The more the transactions are, the higher the volume is. As a rule, to be able to overcome a top/bottom (breakout), it is necessary to have a large volume of transactions (a large amount of money is put into the market). Only then can prices go up (down) sustainably.
Therefore, when trading breakout, it is advisable to add the volume indicator to identify whether it is a real or a fake breakout.
Trade breakout following the trend
Usually, traders have the habit of waiting for the price to break out of the support, resistance, or trendline created by a major trend and trade in the opposite direction. This is very risky. Because a reversal breakout often happens only once for real (it will reverse the whole trend). And most of them are fake breakouts.
Instead, you should watch out for trend-oriented breakouts. The probability of success will be higher.
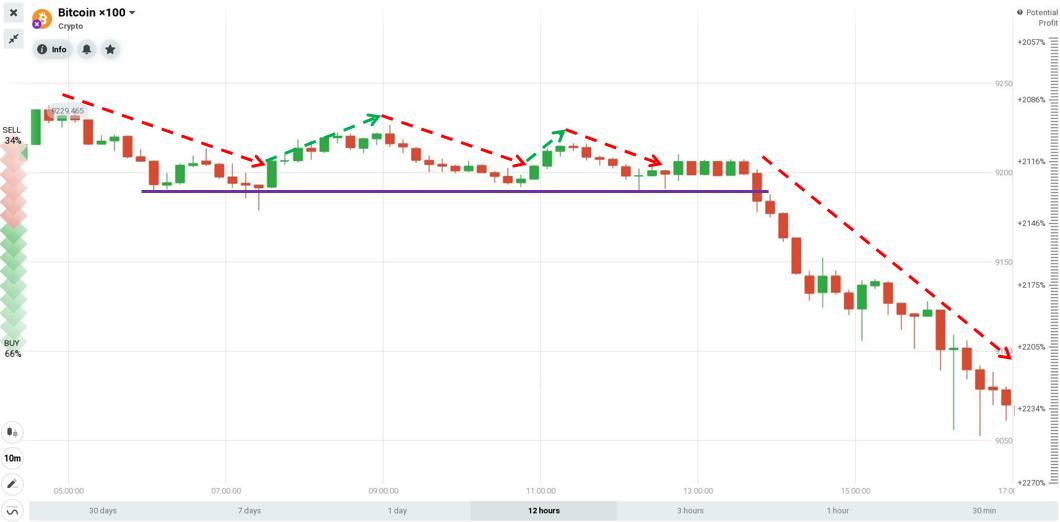
You may notice that the price sometimes slightly adjusts and then resumes the downtrend. This further confirms that the selling is strong and ready to bring prices lower. So you can completely rest assured that trading breakout following the trend will have a higher probability of success.
Of course, there will also be times of failure as prices are about to reverse. But remember that once the price reverses, we only fail once in an uptrend. When the price has turned down, there will be no more bullish breakout action for us to touch the stop-loss. Therefore, the probability of losing is also very low. Anyway, the trend is our friend.
Take advantage of market levels
As a rule, there will be times when the price fluctuates very strongly and is ready to break out of the previous peaks. But there are times when the price fluctuates extremely weakly and easily reverses when facing strong levels. So how do we know whether the level is strong or weak?
According to this chart, Bitcoin will rebound when it returns to the 5800 USD price zone, for example.
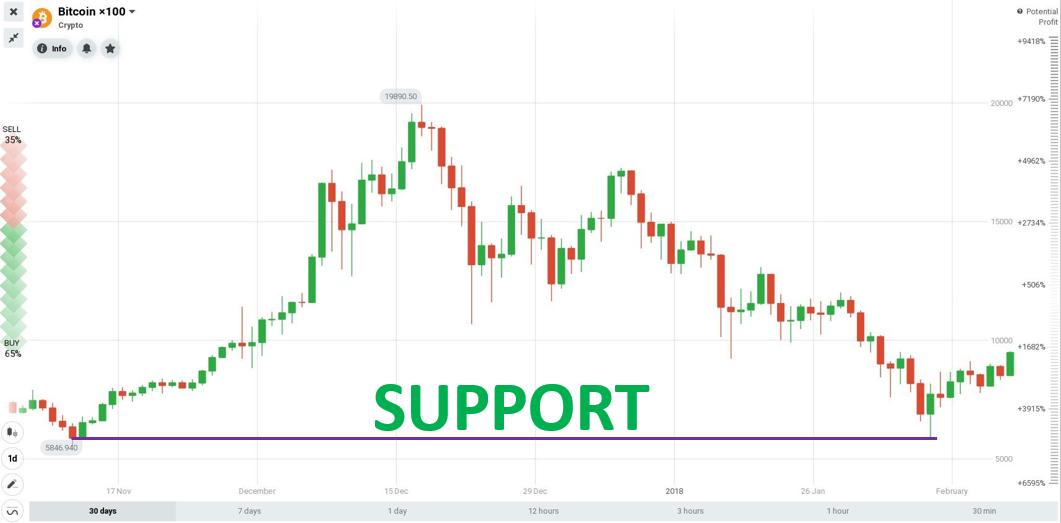
Having grasped this price zone, we will consider opening Buy orders when the price enters this strong support zone.
To conclude
I have just finished sharing a few small tricks for people to trade better with the breakout strategy. Please note that every tip or strategy has its own risks. They can never be completely correct. Therefore, the necessary thing to always comply with is to strictly follow the principles of capital management and risk management.
In the following article, I will review how to trade breakout with Bitcoin in IQ Option. Stay tuned.
Register IQ Option and Get Free $10,000 Risk warning: Your capital might be at risk.
Indonesia Português Tiếng Việt ไทย العربية हिन्दी 简体中文 Nederlands Français Deutsch हिन्दी Italiano 한국어 Melayu Norsk bokmål Русский Español Svenska Tamil Türkçe Zulu


