
 Indonesia
  Português
  ไทย
ไทย  العربية
  हिन्दी
  简体中文
简体中文  Nederlands
  Français
  Deutsch
  हिन्दी
  Italiano
  한국어
한국어  Melayu
  Norsk bokmål
  Русский
  Español
  Svenska
  Tamil
Tamil  Türkçe
  Zulu
Zulu
In early 2020, I set up a new account to trade and calculate the winning rate of long options based on reversal candlestick patterns that have the trust of many traders. In this article, I will review the first week from January 6, 2020 to January 10, 2020 with a profit of 38.6% using the trading strategy of Morning Star candlestick pattern and the support level.
I confirm once again that I don’t lure newbies. Neither sell courses nor give trading signals. I share the entry points that I have made myself and record the results. From there, everyone can have an overview of the winning rate of each candlestick pattern in IQ Option.
Trading strategy with Morning Star candlestick pattern and the support level
The strategy is very simple. It comes from the most basic things such as (1) A basic candlestick pattern (Morning Star) => (2) The most basic indicator (Support) => (3) One way to open options (HIGHER).
Standard Morning Star candlestick pattern
The standard Morning Star candlestick pattern consists of 3 candles.
The first candle is a relatively long bearish candlestick compared to the previous ones.
The 2nd candlestick is usually a Doji candle (Bullish or Bearish).
The 3rd is a bullish candle that is equal or equal to at least 50% in length of the 1st candlestick.
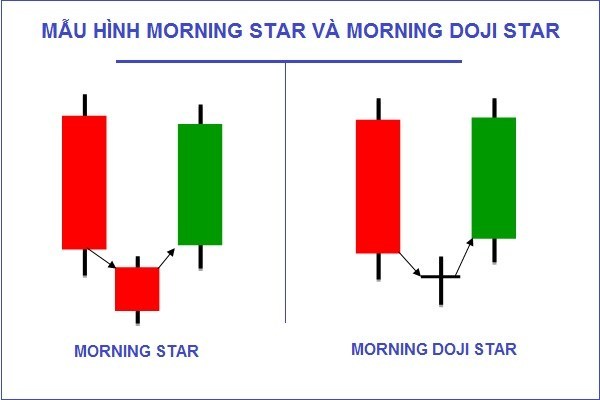
=> This pattern is easy to recognize with a high win rate when it appears.
On the other hand, a Morning Star variation pattern consists:
The 1st candlestick is a relatively long bearish candle compared to other previous ones.
Next are a series of Doji candlesticks that have the closing prices nearly equal to the closing price of the 1st candle. The price accumulates to prepare for a strong breakout.
The 3rd is a bullish candlestick that has the length equal to or at least 50% compared to the first candle. It marks the end of the tension and a new uptrend is about to start.
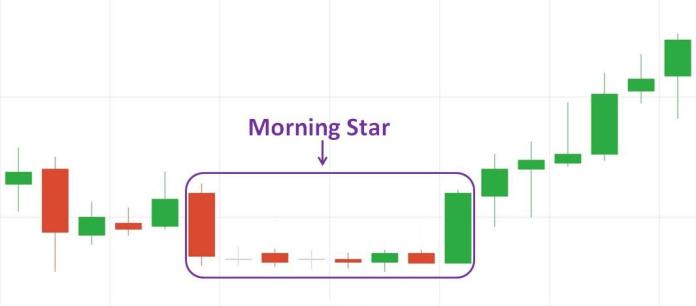
=> This pattern is difficult to recognize. But in return, its winning rate is very high every time it shows up.
The most basic indicator: Support level
When the price stops decreasing at an important price level, it is called the support zone (level). The more candles are rejected at the support level, the higher it could be broken out at any time. It is necessary to identify the support zone to have nice entry points right there.
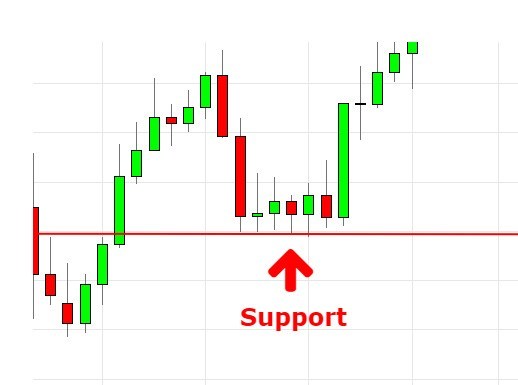
Enter the HIGHER option
When the Morning Star pattern has appeared right at the support level, it is the best entry point to enter a long HIGHER option (from 15 minutes or more).
Steps to prepare when trading with Morning Star candlestick and Support
(1) Currency pair: EUR/USD, USD/JPY.
(2) Japanese candlestick chart and 5-minute candle time period.
(3) The expiration time is 15 minutes or more.
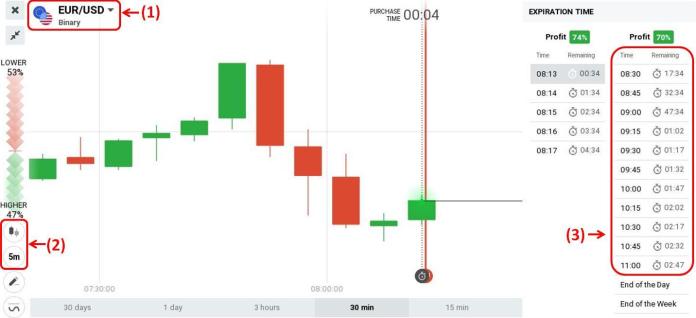
Entry signal:
HIGHER = Morning Star candlestick pattern + support.
How to manage capital with Morning Star and Support trading strategy
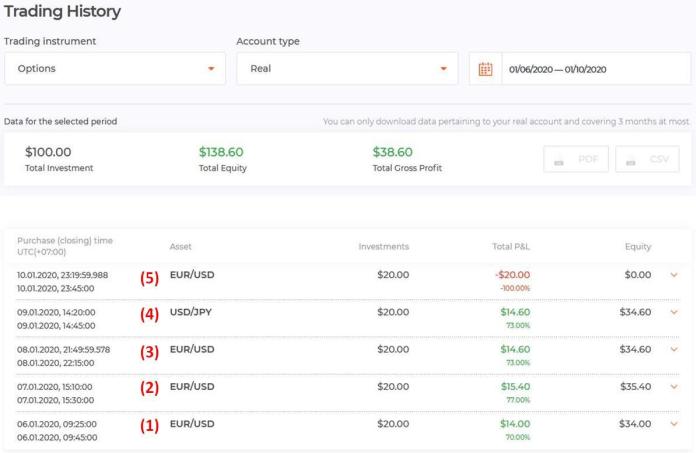
I use Classic capital management strategy by week. Open 1 option $20 per day from Monday to Friday (January 6 to January 10).
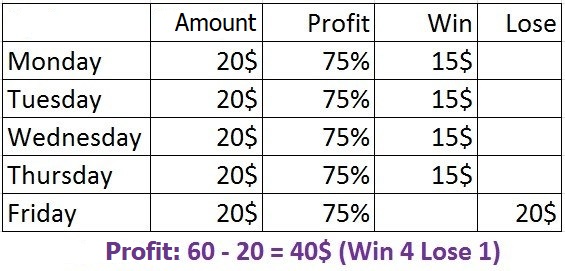
Profit: 38.6%
Entry points from January 6, 2020 to January 10, 2020
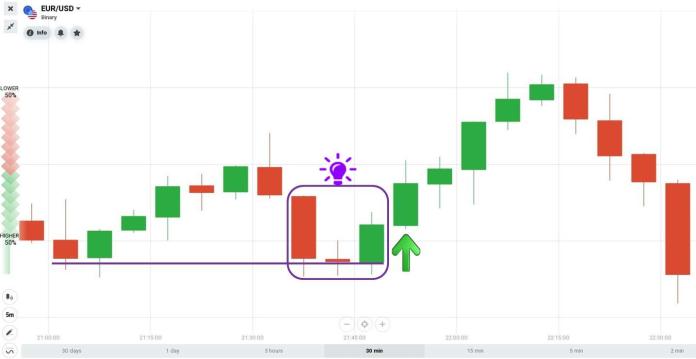
Option 1: on Monday, January 6, 2020 – EUR/USD currency pair in the Asian session. A standard Morning Star candle pattern appeared at a strong support. Before this pattern, there was a Pinbar candle with a long lower wick. I entered a HIGHER option that ended in the next 20 minutes.
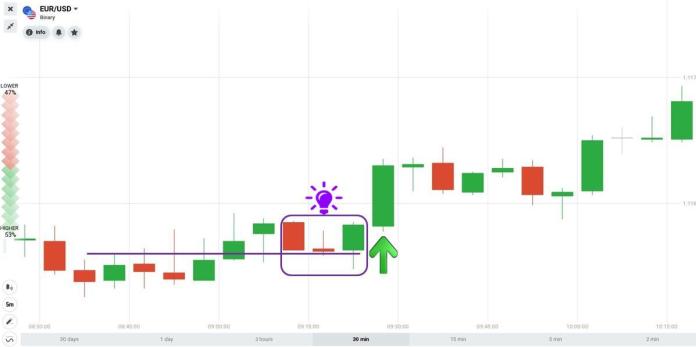
Option 2: on Tuesday, January 7, 2020 – EUR/USD currency pair in the European session. This was a relatively volatile time. A Morning Star pattern showed up right at the support zone which had just formed. I opened a HIGHER option with the 20-minute expiration time.
Option 3: on Wednesday, January 8, 2020 – EUR/USD pair in Europe + US session. This is the time when the interference between the two sessions is quite strong. The volatility is very large and there is news that strongly affects the exchange rate of EUR/USD. Right at the support level, the Morning Star candlestick pattern was created. I bought a HIGHER option that finished in 25 minutes.
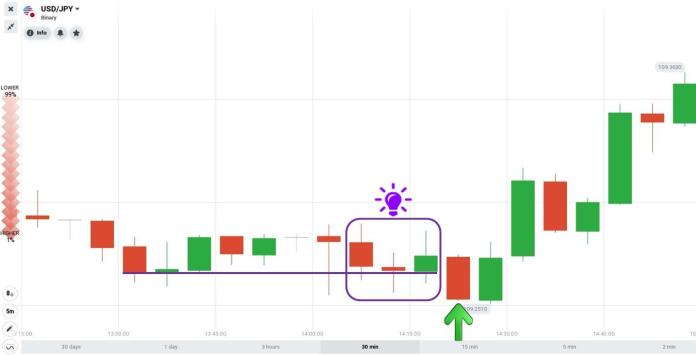
Option 4: on Thursday, January 9, 2020 – USD/JPY currency pairs in the European session. At this time, this price was quite stable. A support zone has appeared when the price formed a Pin bar candle with a long lower wick. It shows that the support zone was difficult to be broken. Morning Star candlestick pattern was created right at the strong support zone = Enter a HIGHER option the ended in 25 minutes.
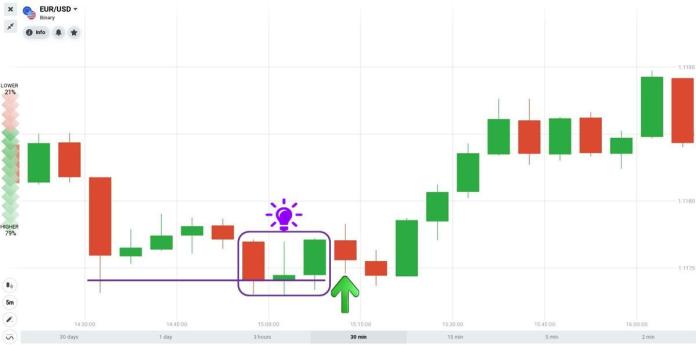
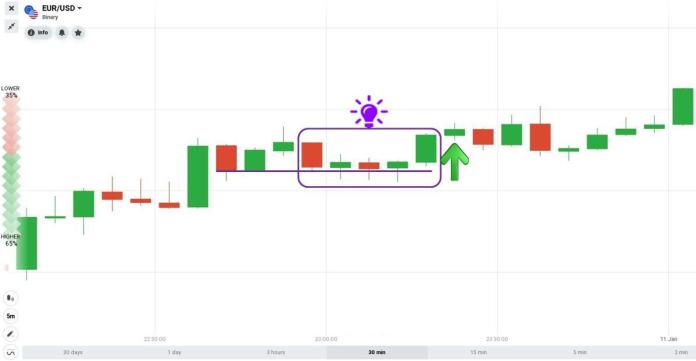
Option 5: on Friday, January 10, 2020 – EUR/USD in Europe and America session. At the support zone, the price created 3 consecutive Doji candles showing that there was tension between buyers and sellers here. The next candlestick was a relatively long bullish candle. Identified the Morning Star variation pattern at the support level = Opened a HIGHER option with the 25-minute expiration time.
Pros and cons of Morning Star pattern and Support trading strategy
Advantages
Have a high winning rate.
Easy to identify.
Simple to use.
Disadvantages
Morning Star candle pattern rarely appears so if you want to use this strategy, you have to be patient.
Summary
Simplicity in trading is what every trader needs to achieve. In options trading, we should create effective strategies that are not distracted by the things we draw in our heads. Don’t complicate the problem excessively while in essence, it’s really simple.
When I first started trading, I went from simple to complex. But once I understood the core issues in the financial market, my method is to make complicated things as simple as possible.
Understand what the problems are. Find out which tools can solve these problems quickly and effectively. After answering these two questions, you have somewhat simplified your trading processes in the most optimal way.
Indonesia Português ไทย العربية हिन्दी 简体中文 Nederlands Français Deutsch हिन्दी Italiano 한국어 Melayu Norsk bokmål Русский Español Svenska Tamil Türkçe Zulu


Wow, attractive portal. Thnx …