 Indonesia
  Português
  Tiếng Việt
  ไทย
ไทย  العربية
  हिन्दी
  简体中文
简体中文  Nederlands
  Français
  Deutsch
  हिन्दी
  Italiano
  한국어
한국어  Melayu
  Norsk bokmål
  Русский
  Español
  Svenska
  Tamil
Tamil  Türkçe
  Zulu
Zulu
In the financial market, it can be said that Fibonacci indicator is an effective tool used by many professional traders. So what is Fibonacci? How does it work? How to use Fibonacci and trade in IQ Option? Let’s find out through this article.
What is Fibonacci indicator?
Fibonacci is a series of numbers from left to right after the first 2 numbers. The increasing value in the series of numbers that each of the following numbers is decided by the sum of the 2 consecutive previous numbers. For example:
0, 1, 1, 2, 3, 5, 8, 13, 21, 34, 55, 89, 144, 233, 377 next numbers are 610 ..
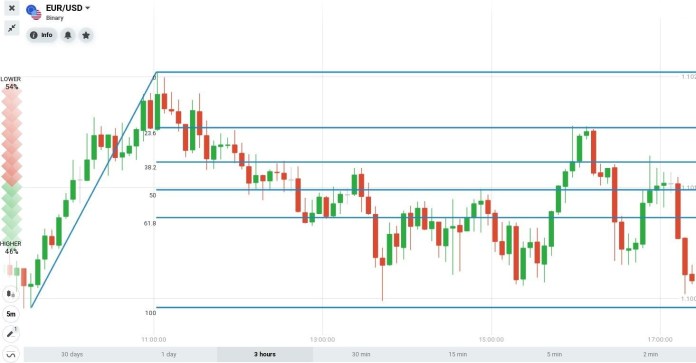
Fibonacci consists of 2 levels
The Fibonacci retracement levels will be 0.236, 0.382, 0.500, 0.618, 0.764.
And the Fibonacci extension levels will be 0, 0.382, 0.618, 1,000, 1,382, 1.618.
How to set up Fibonacci indicator
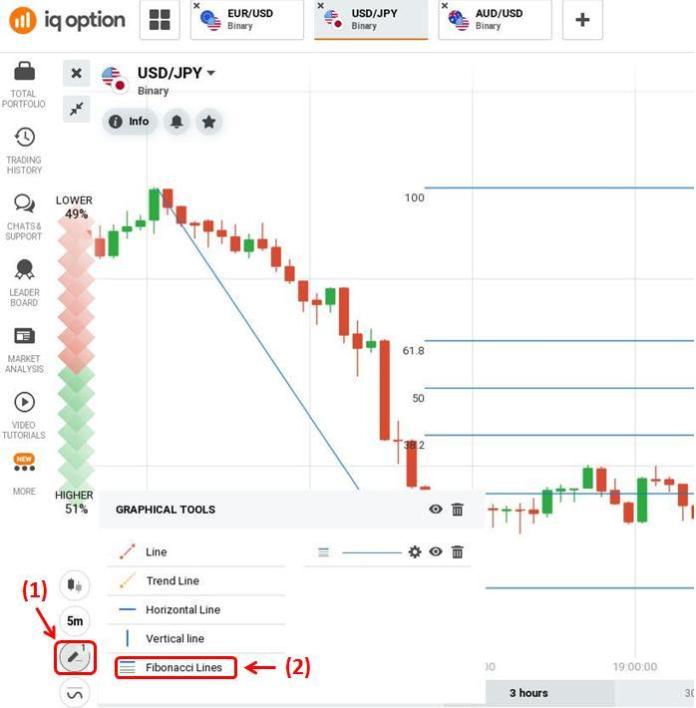
To set the Fibonacci sequence. (1) Click Graphical Tools => (2) Select Fibonacci Lines.
How to use Fibonacci in IQ Option
Use the Fibonacci sequence to identify support/resistance
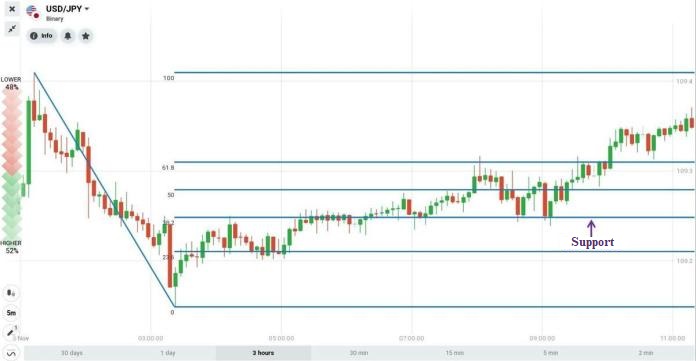
First of all, it is necessary to identify Swing high, which is a candlestick that stands at the top of a trend with the lower tops adjacent to its left and right. On the contrary, Swing Low reversal bottom is a candlestick that has the lowest price compared to its left and right candlesticks.
Use the Fibonacci regression to draw a chart connecting Swing High to Swing low. From there, the support levels will be formed.
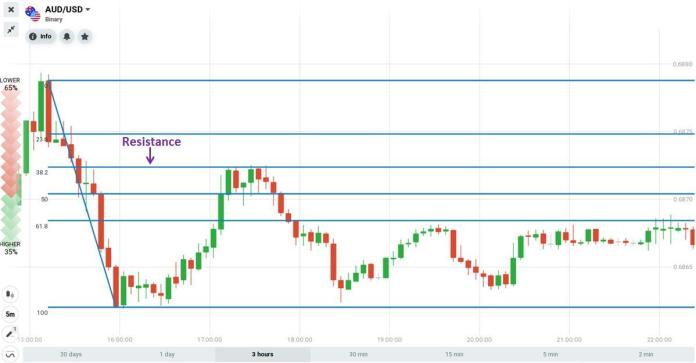
Use the Fibonacci regression to draw a chart connecting Swing Low to Swing High. From there, the resistance levels will be formed.
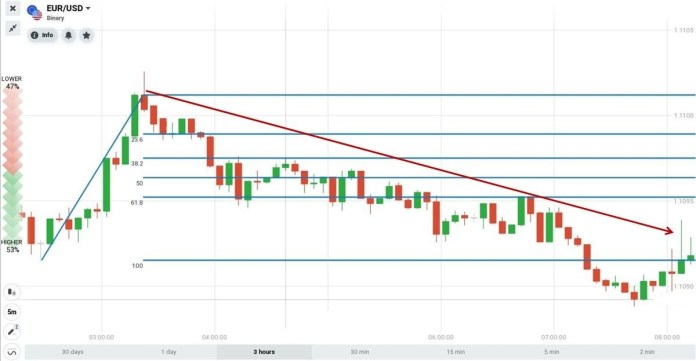
Use the Fibonacci numbers to identify trends
Three Black Crows candlestick pattern appears at the top of the trend. It’s a high chance that there will be a price reversal based on the Fibonacci sequence.
IQ Option trading strategy with Fibonacci indicator
Use the Fibonacci indicator to identify resistance and support zones and combine SMA indicator to enter a safe trade. The expiration time is from 15 minutes or more.
Strategy 1: Fibonacci indicator combines with SMA indicator
If we can identify support and resistance with the Fibonacci level, when the price is near SMA, we focus on observing the price reaction to have a safe entry point.
Requirements: Japanese 5-minute candlestick chart + Fibonacci + SMA30. The expiration time is 15 minutes or more.
How to trade:
HIGHER = Uptrend + Price enters the support zone defined by Fibonacci + The price moves up and cuts SMA from below.
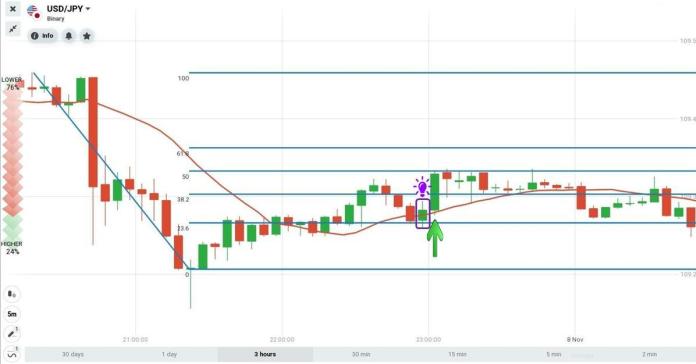
LOWER = Downtrend + The price enters the resistance zone defined by Fibonacci + the price crosses SMA from above.
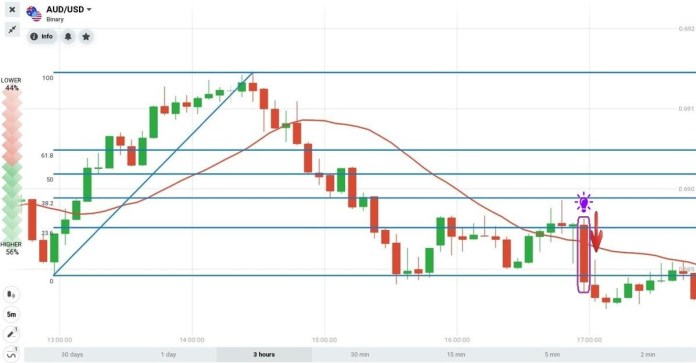
Strategy 2: Fibonacci indicator works with reversal candlestick patterns
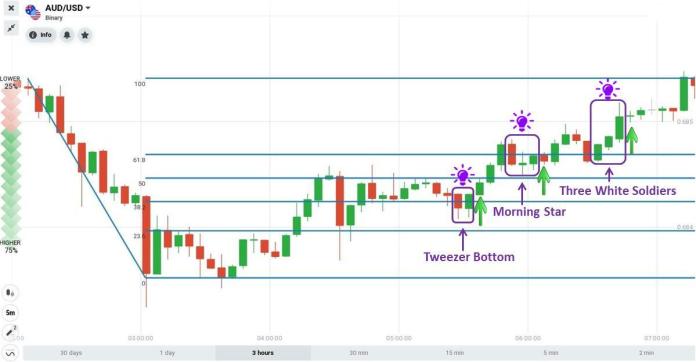
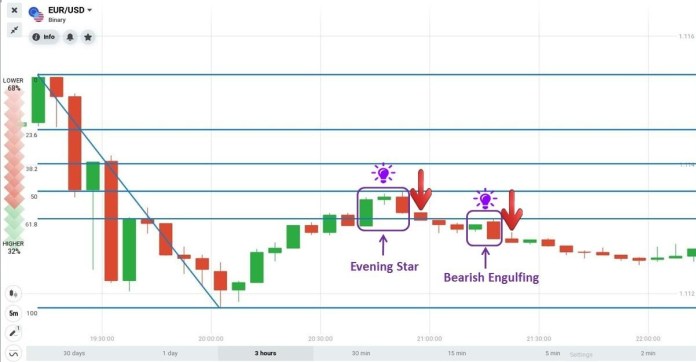
You can use Fibonacci with a reversal candlestick pattern in the level zone to have a safe entry point.
Requirements: Japanese 5-minute candlestick pattern + Fibonacci. The expiration time is 15 minutes or more.
How to trade
HIGHER = Uptrend + Fibonacci + Bullish candlestick pattern (Tweezer Bottom, Morning Star, Three White Soldiers).
LOWER = Downtrend + Fibonacci + Bearish candlestick pattern (Evening Star, Bearish Engulfing).
After reading this article, you can try Fibonacci indicator with Demo account in IQ option platform to experience these interesting trading strategies.
 Indonesia
  Português
  Tiếng Việt
  ไทย
ไทย  العربية
  हिन्दी
  简体中文
简体中文  Nederlands
  Français
  Deutsch
  हिन्दी
  Italiano
  한국어
한국어  Melayu
  Norsk bokmål
  Русский
  Español
  Svenska
  Tamil
Tamil  Türkçe
  Zulu
Zulu
