
 Indonesia
  Português
  Tiếng Việt
  ไทย
ไทย  العربية
  हिन्दी
  简体中文
简体中文  Nederlands
  Français
  Deutsch
  हिन्दी
  Italiano
  한국어
한국어  Melayu
  Norsk bokmål
  Русский
  Español
  Svenska
  Tamil
Tamil  Türkçe
  Zulu
Zulu
For traders who follow the price action school, it is probably not unfamiliar with price or candlestick patterns. They have become very common in the trading process when bringing safety to traders. So in this article, I will show you more advanced price patterns to use in Forex trading in IQ Option, which called Harmonic.
These patterns are classified in the advanced group because of their rather complex nature. Not only must there be special shapes through visual observation, the Harmonic patterns must also be accurately determined the proportions of the lines and edges that form those special shapes. And when the pattern is correctly defined, its trading efficiency will be immense.
Register IQ Option and Get Free $10,000 Risk warning: Your capital might be at risk.
Important Harmonic price patterns in Forex
In this article, I will briefly introduce the important Harmonic patterns in Forex trading. I will cover the identifying characteristics, market psychology behind each pattern in IQ Option.
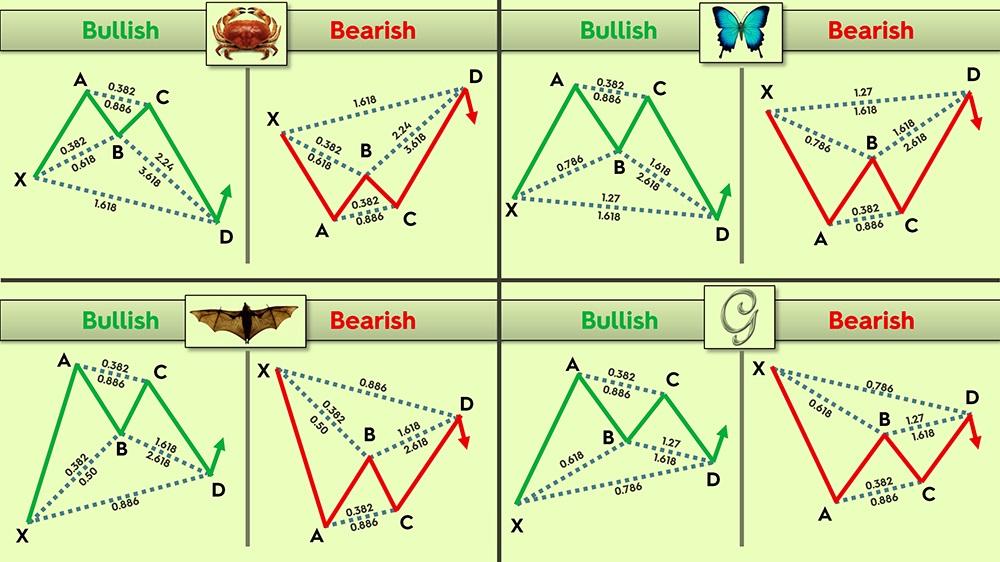
There are many variations of the original Harmonic pattern. Among them, there are are some important and commonly used patterns in Forex trading. These include:
- Gartley
- Bat
- AB=CD
- Three Drives
- Butterfly
- Crab
Steps to trade with Harmonic price pattern
The most important and difficult stage when trading with Harmonic patterns is to identify them because it requires you to measure the ratios correctly. Just merely looking at the shape through the eyes with relative estimates is never enough.
The process of trading with Harmonic patterns can be divided into 3 steps as follows:
Step 1: Identify potential Harmonic patterns
With the observation of the behavior, the movement of the price on the chart, you can determine if the price is forming a Harmonic pattern or not. All price patterns have distinctive and evocative shapes so that you can completely observe with your eyes and imagine. Of course, it depends on each person’s ability to observe and think about images.
For example, price movement forms an M-like shape. Some traders see a Butterfly pattern, while other see a crab.
To know exactly which Harmonic pattern is, we must proceed to the next step.
Step 2: Measure the Fibonacci ratios
The purpose is to make sure it’s exactly one of the Harmonic patterns.
You use Fibonacci to measure the ratios at the reversal points in the pattern.
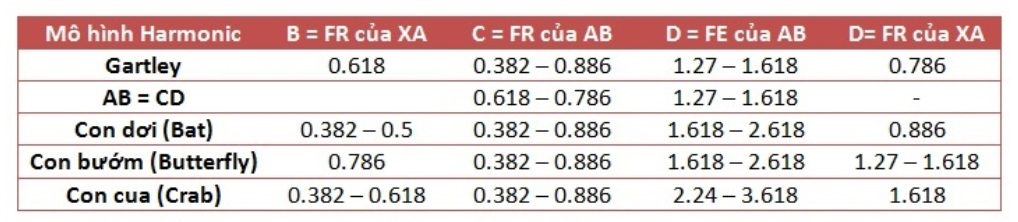
To make it easy for comparison of measured results and sample rates on each model, you can make a Fibonacci ratios chart of the Harmonic patterns as shown below. Then record the measured ratios on paper and compare.
Step 3: Enter the trade or stay out of the market
If the measured Fibonacci ratios match one of the Harmonic ratio patterns, you enter the trade after the pattern has just ended or wait for the appearance of confirmation candlesticks.

On the contrary, you should stay out and continue to observe the price behavior.
Pros and cons of the Harmonic price pattern
Pros
Harmonic price patterns are more standardized using Fibonacci ratios. That’s why it can completely eliminate the emotional element. They are far different from just observing and judging with the eyes like other price patterns. And once those criteria are satisfied, the winning rate is very high.
Harmonic can work well on a wide variety of timeframes. It’s also suitable for all types of financial assets in the market.
The price action of Harmonic patterns forms basic waves. They consist of major waves and alternating corrective waves, which are easy to appear and repeat often.
Can be used in combination with other technical indicators to increase reliability.

Cons
Complicated, due to the step of measuring the Fibonacci ratios
Harmonic patterns are very similar to other price patterns like Double Top or Double Bottom. If you do not practice regularly, you will be very confused when trading live, which may easily lead to incorrect judgment.
Trading with the Harmonic price pattern requires many complex techniques. You need time to learn more about each specific pattern. Then practice, observe and measure the Fibonacci ratios a lot to master it.
To conclude
To become a successful Forex trader in IQ Option, the Harmonic price patterns are things you cannot ignore. If you can catch the time these patterns appear, they will bring a huge profit for you.
Practice patiently on the Demo account before trading live to limit the risk as low as possible. We will have specific tutorials and reviews of each pattern in the next articles. Remember to update and follow this blog.
Register IQ Option and Get Free $10,000 Risk warning: Your capital might be at risk.
Indonesia Português Tiếng Việt ไทย العربية हिन्दी 简体中文 Nederlands Français Deutsch हिन्दी Italiano 한국어 Melayu Norsk bokmål Русский Español Svenska Tamil Türkçe Zulu


