
 Indonesia
  Português
  Tiếng Việt
  ไทย
ไทย  العربية
  हिन्दी
  简体中文
简体中文  Nederlands
  Français
  Deutsch
  हिन्दी
  Italiano
  한국어
한국어  Melayu
  Norsk bokmål
  Русский
  Español
  Svenska
  Tamil
Tamil  Türkçe
  Zulu
Zulu
Brazilian traders have been very successful with the strategy of using Parabolic Sar indicator together with Support and Resistance. What are their IQ Option trading formulas? What capital management strategy do they use? The questions will be answered in this article.
I also review some entry points that I enter with this strategy in IQ Option.
Register IQ Option and Get Free $10,000 Risk warning: Your capital might be at risk.
IQ Option trading strategy: Parabolic Sar indicator with Support and Resistance
Basic set up before trading
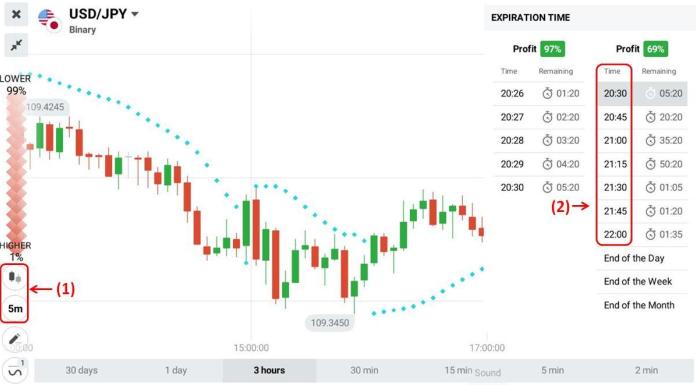
Select trading assets: AUD/USD, USD/JPY, EUR/USD.
Japanese 5-minutes candlestick chart.
The expiration time is 15 minutes or longer.
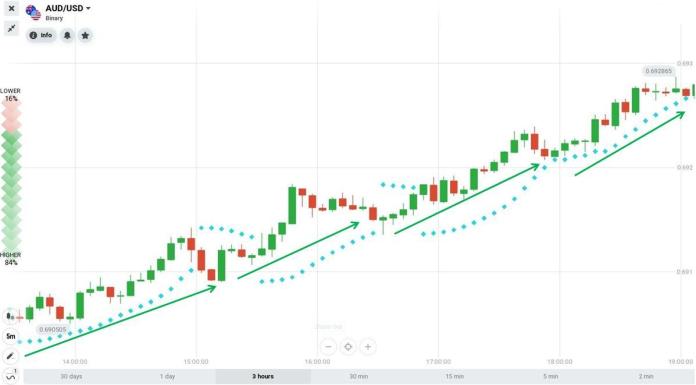
Parabolic Sar is an indicator that clearly confirms the direction and timing of the market trend as well as potential reversal points.
Below picture is an example of Parabolic Sar indicator in an uptrend.
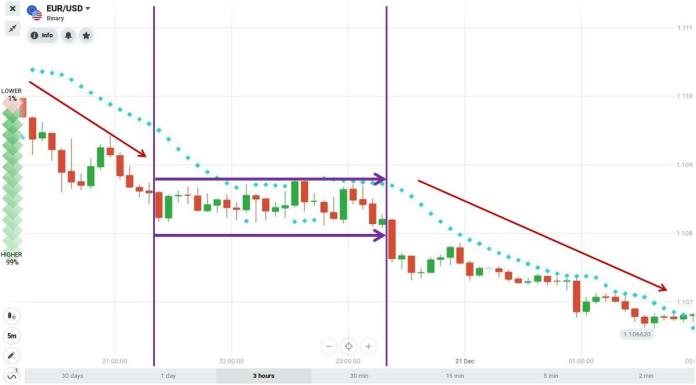
Below picture is an example of Parabolic Sar indicator in a downtrend.
IQ Option trading formula
To keep things simple, we only enter a trade when the trend is clearly confirmed. In an uptrend, we only open HIGHER options. In a downtrend, we find reasonable LOWER entry points.
With this IQ Option strategy, Parabolic Sar indicator plays a role in identifying the trend. Support and Resistance levels act as an entry signal.
HIGHER = Parabolic Sar indicator in uptrend + Support.
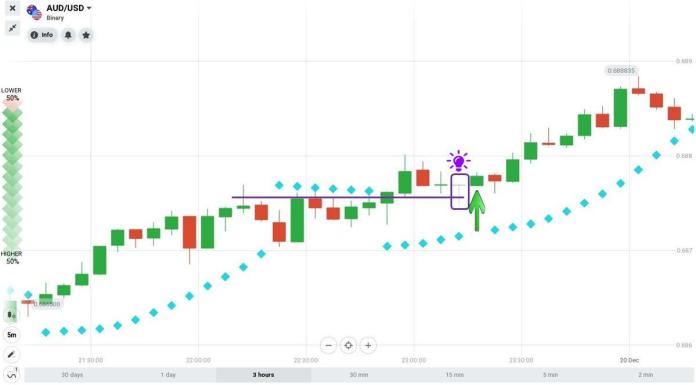
Explain: When the price is in an uptrend, it will increase continuously and break through the resistance => The old resistance will become a new support zone.
In those increasing movements, there will be corrections that decrease and test this new support. This is a signal for you to open HIGHER options.
LOWER = Parabolic Sar indicator in downtrend + Resistance.
How to manage capital appropriately
The safest way to protect your account in a high-risk market is to set an account limit on profit and loss. A method that is carefully calculated to protect your money so that the amount of bet does not go beyond the limit of the account is Fibonacci capital management.
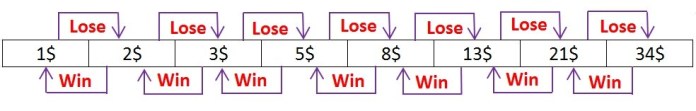
Fibonacci method is quite simple. When you lose, forward 1. When you win, backward 1.
Details are as follows:
You bet $1 – lose -> $2 – lose -> $3 – lose -> $5 – lose -> $8 – win -> $5 – win -> $3 – win -> $2 – win -> $1.
If you win from $8, start the stop loss cycle. If you lose in the stop loss cycle, continue to use the formula: win – forward 1, lose – backward 1.
Details are as follows:
You bet $1 – lose -> $2 – lose -> $3 – lose -> $5 – lose -> $8 – win -> $5 – lose -> $8 – win -> $5 – win -> $3 – lose -> $5 – win -> $3 – win -> $2 – win -> $1.
The total capital for the above 8-option cycle is $87.
Some rules to remember when trading options in IQ Option
Setting a certain limit on profit and loss. When reaching the limit, you need to stop trading and log out of the account.
Only open an option when the price has determined the trend with certainty. When the transaction is made, we simply wait for the market to indicate whether our decision is right or wrong.

Review IQ Option entry points
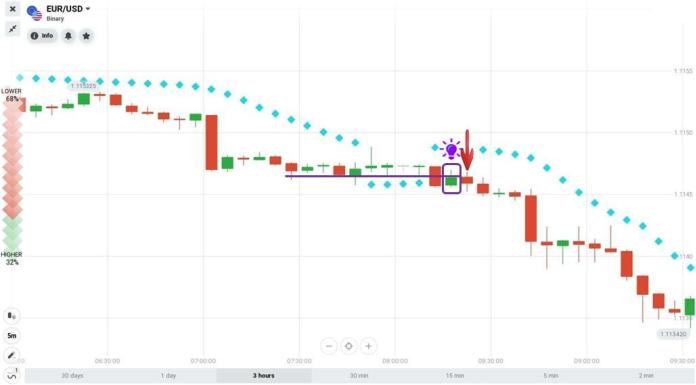
Option 1: Price breaks Support and goes down. Parabolic Sars are above the candlesticks => Downtrend – Only wait to open a LOWER option => The old support now becomes a new resistance.
The price tests the Resistance zone => Open a LOWER option with the 15-minute expiration time.
Result => Win.
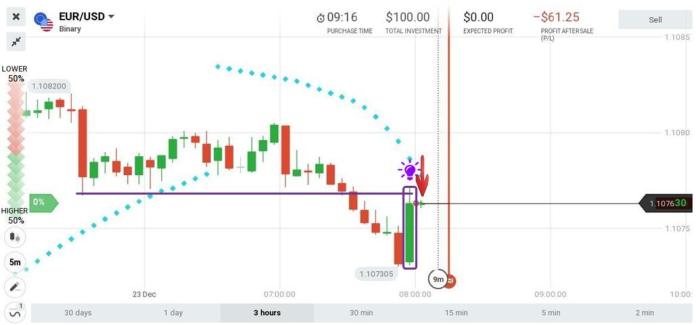
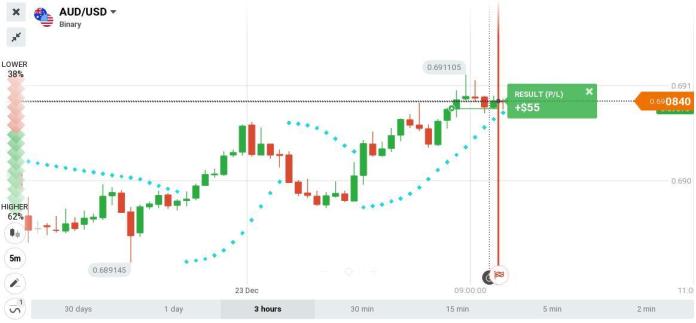
Option 2: Price keeps rising and breaks the resistance level. Parabolic Sar indicator is below the candlesticks => Uptrend – Waiting to open a HIGHER option. The old resistance now becomes a new support.
The price temporarily falls to a new support level => Open a HIGHER option with the 25-minute expiration time.
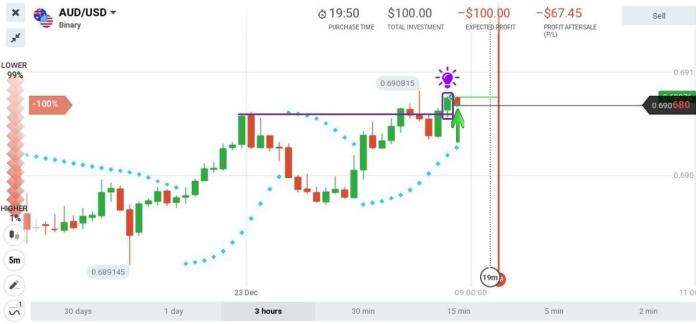
Result => Win
Summary
This is an IQ Option strategy that focuses on Trend and Signal. Use Parabolic Sar to determine trends. Support and Resistance are the entry signal.
The only secret in financial trading lies in only 2 words. Discipline and Patience. Test this strategy with your Demo account in IQ Option. Good luck!
Register IQ Option and Get Free $10,000 Risk warning: Your capital might be at risk.
Indonesia Português Tiếng Việt ไทย العربية हिन्दी 简体中文 Nederlands Français Deutsch हिन्दी Italiano 한국어 Melayu Norsk bokmål Русский Español Svenska Tamil Türkçe Zulu


