
 Indonesia
  Português
  Tiếng Việt
  ไทย
ไทย  العربية
  हिन्दी
  简体中文
简体中文  Nederlands
  Français
  Deutsch
  हिन्दी
  Italiano
  한국어
한국어  Melayu
  Norsk bokmål
  Русский
  Español
  Svenska
  Tamil
Tamil  Türkçe
  Zulu
Zulu
Two of the most effective indicators when trading in IQ Option are RSI and Support/Resistance. Combined with an effective capital management method, it creates a safe trading strategy in IQ Option. In this article, I will guide you in detail on an IQ Option trading strategy. It is a reversal strategy that is most effective when using the combination of RSI indicator and support/resistance.
Register IQ Option and Get Free $10,000 Risk warning: Your capital might be at risk.
Trading strategy in IQ Option: RSI combined with resistance/support
How to set up the strategy when combining RSI and levels
– Choose the trading assets including 3 main currency pairs: AUD/USD, USD/JPY, EUR/USD.
– The 5-minute Japanese candlestick chart.
– The expiration time of 15 minutes or above.
– Identify the RSI 14 indicator (Purple), the overbought zone 70 (Green), the oversold zone 30 (Red).
– Identify resistance and support zones
Formula for opening orders
HIGHER = The RSI indicator in the oversold zone + support.
LOWER = The RSI indicator in the overbought zone + resistance.
Open an order according to the strongest divergence of the RSI.
HIGHER = A bullish divergence occurs when the price is falling, but the RSI is up => The price is about to reverse from down to up.
LOWER = A bearish divergence occurs when the price is climbing, but the RSI is down => The price is about to reverse from up to down.
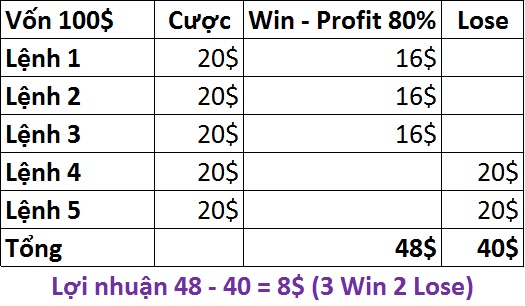
Suitable capital management method
Managing capital with the Classic method is both safe and profitable if the winning rate is over 60%.
Some principles to keep in mind
If you choose reversal trading, enter the trade when the market is sideways or the session is less volatile. Select the following currency pairs:
– EUR/USD in Asian session => Less volatility, consistent with reversal strategy.
– USD/JPY, AUD/USD in European and American sessions => The market usually moves sideways, favorable for reversal trading.
As for diverging trading, you should choose the time when the market tends to increase or decrease. Select the following currency pairs:
– EUR/USD in European and American sessions => The market easily creates trends and divergence.
– USD/JPY, AUD/USD in Asian session => Strong fluctuations, divergence often appears.
Do not open orders consecutively.
Combining the RSI indicator with support/resistance creates a reversal trading strategy at the overbought or oversold points. If the price does not reverse in the overbought zone but continues to rise. Do not open LOWER orders continuously because the possibility of losing is very high. Only open one order when all the conditions are met.
Conversely, if the price does not reverse in the oversold zone and continues to fall, it is advisable not to open HIGHER orders continuously. Only open one order in line with the strategy.
Review on entry points in IQ Option
Reversal trading using the strategy of combining RSI with support/resistance
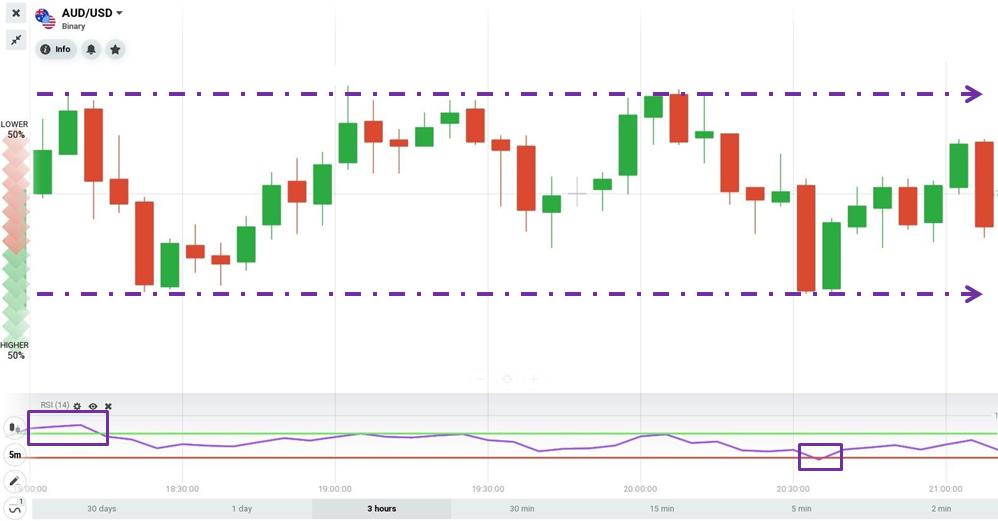
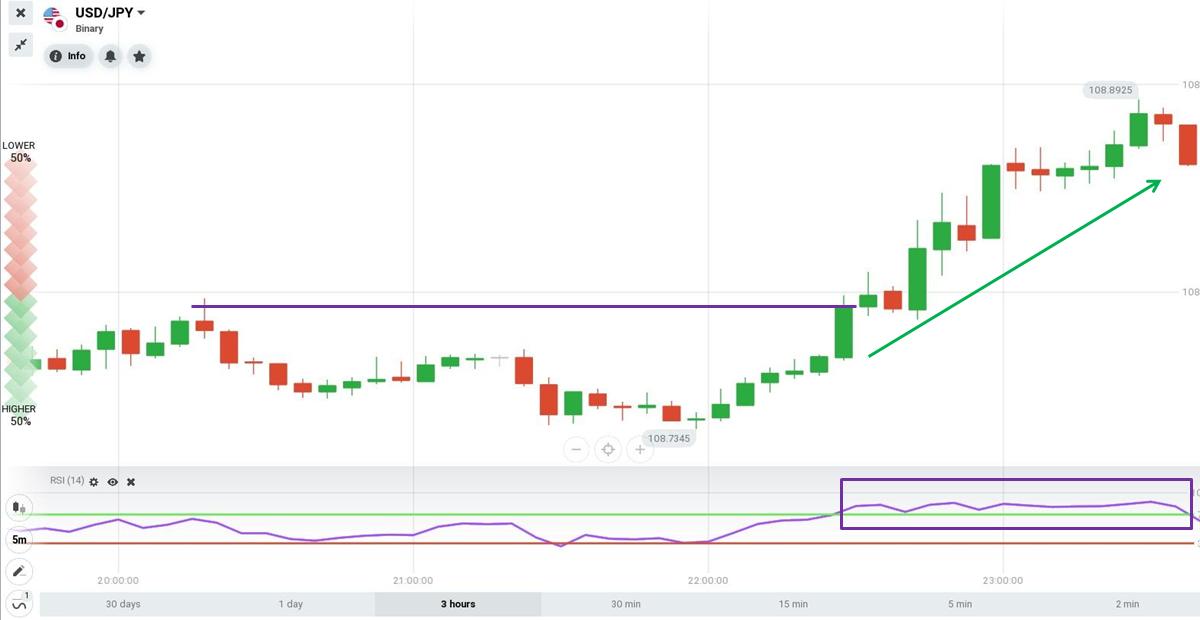
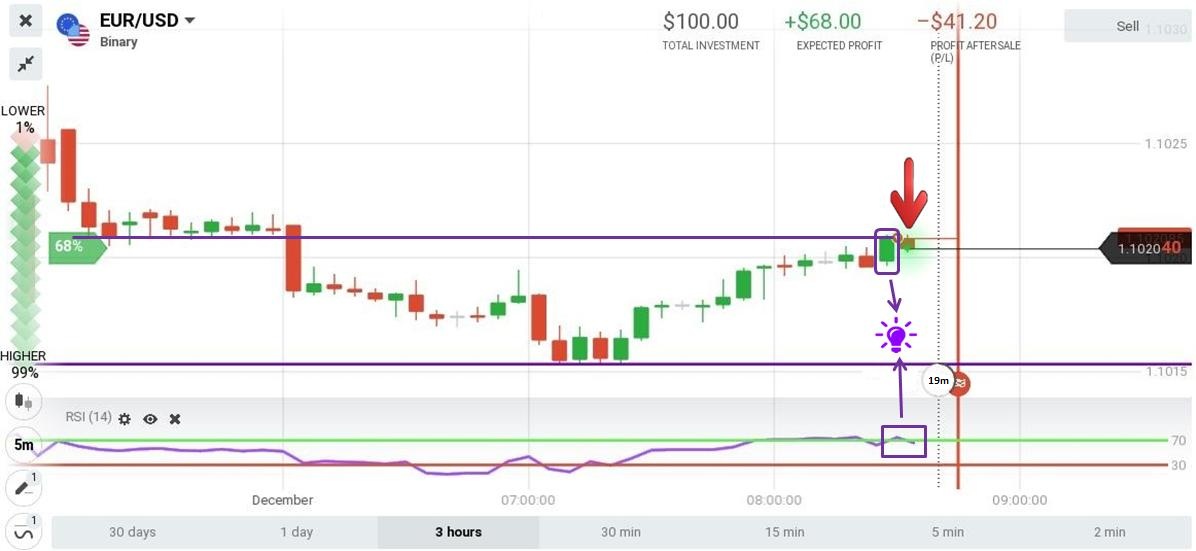
HIGHER = RSI in the oversold zone + support.
Explanation: The price entered the resistance zone when the RSI crossed the oversold line => The reversal possibility was high => Opened a HIGHER order with the expiration time of 20 minutes.
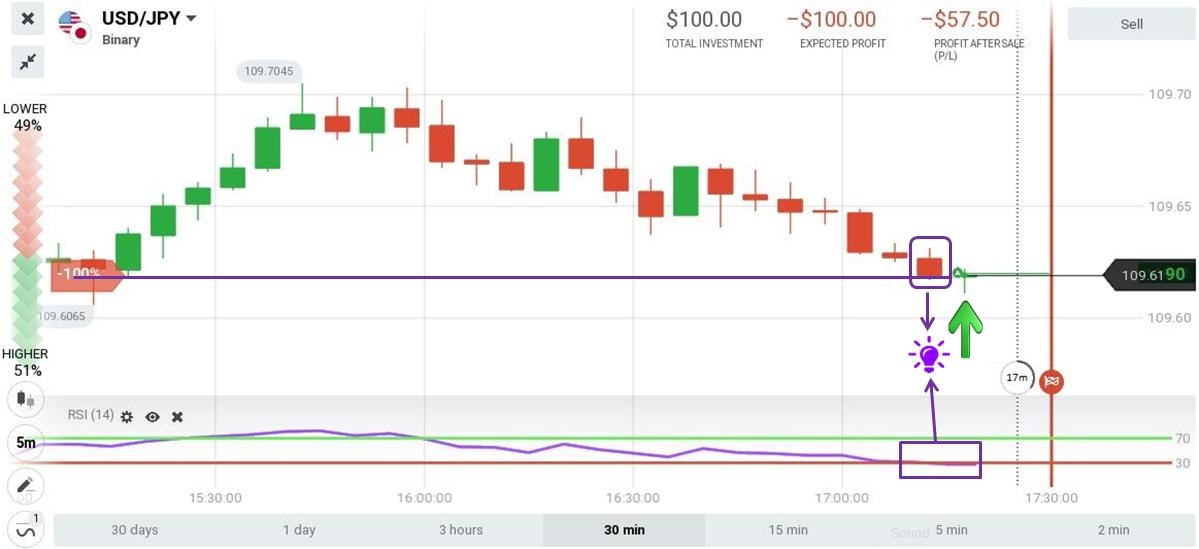
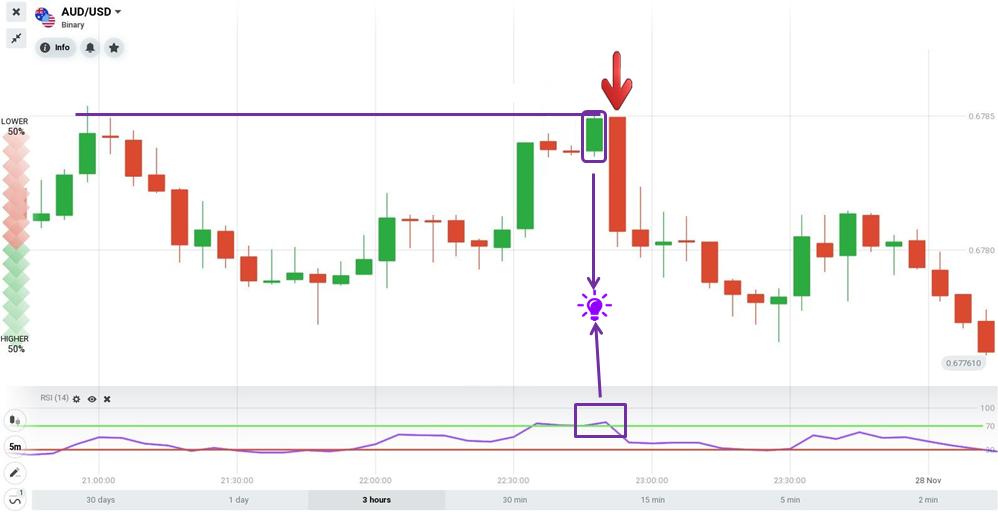
LOWER = RSI in the overbought zone + resistance.
Open an order using the RSI divergence
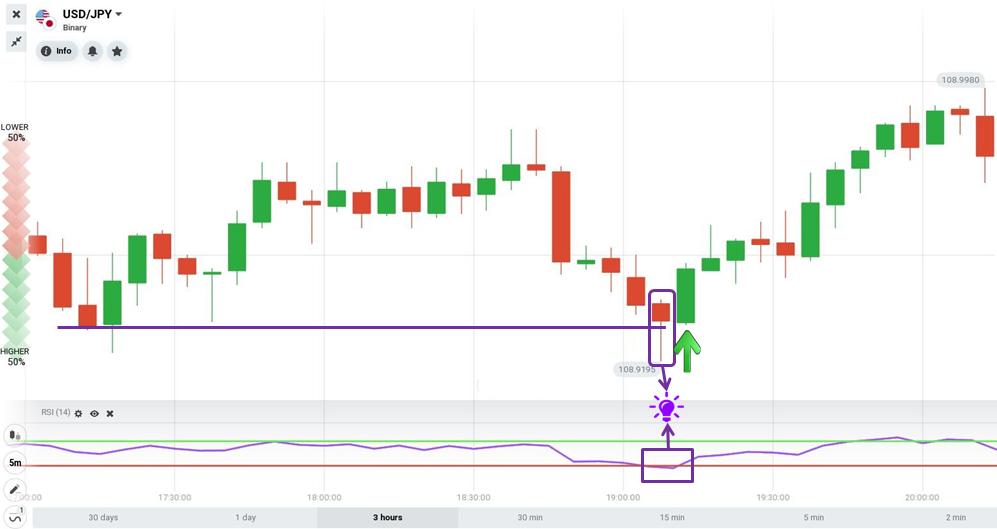
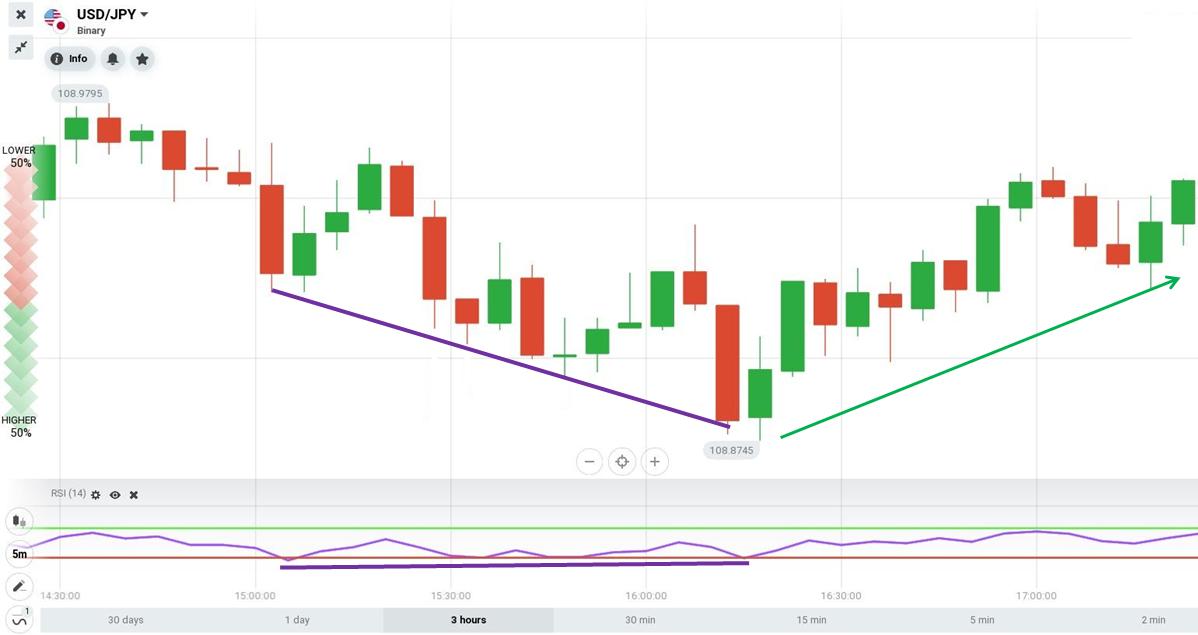
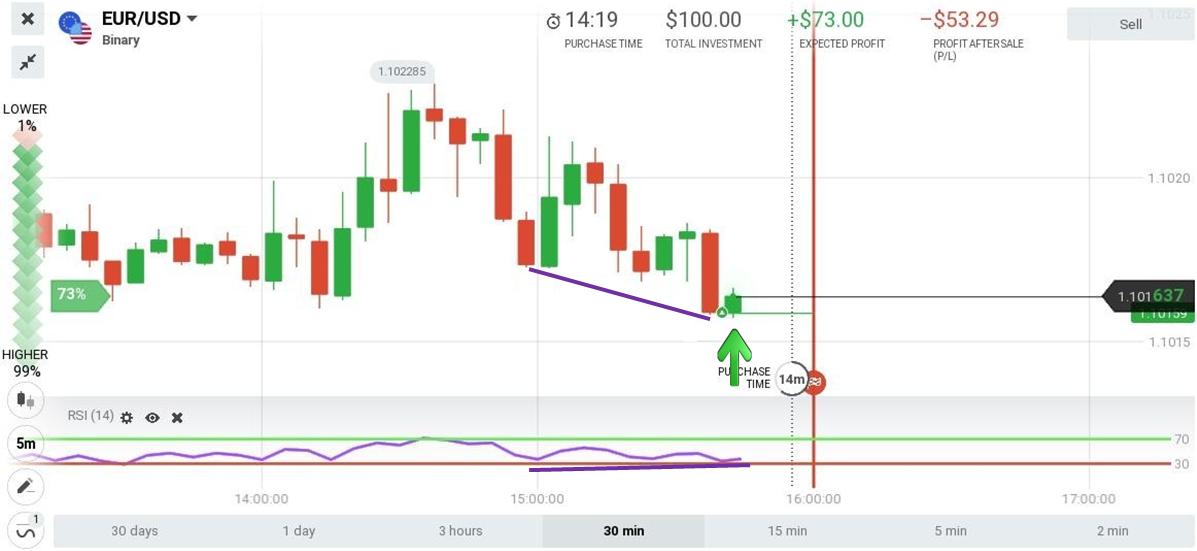
HIGHER = The appearance of the bullish divergence.
The trend was down. The price created lower troughs after troughs, but the RSI indicator went up which was against the price => bullish divergence signaled a reversal from down to up => Opened a HIGHER order with an expiration time of 15 minutes.
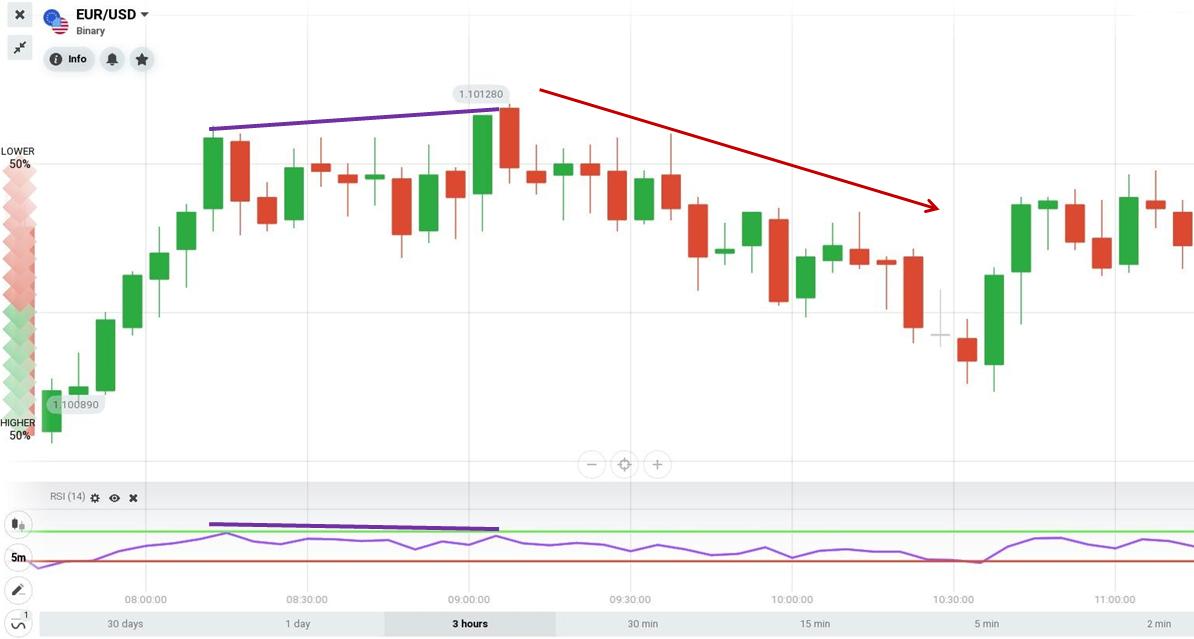
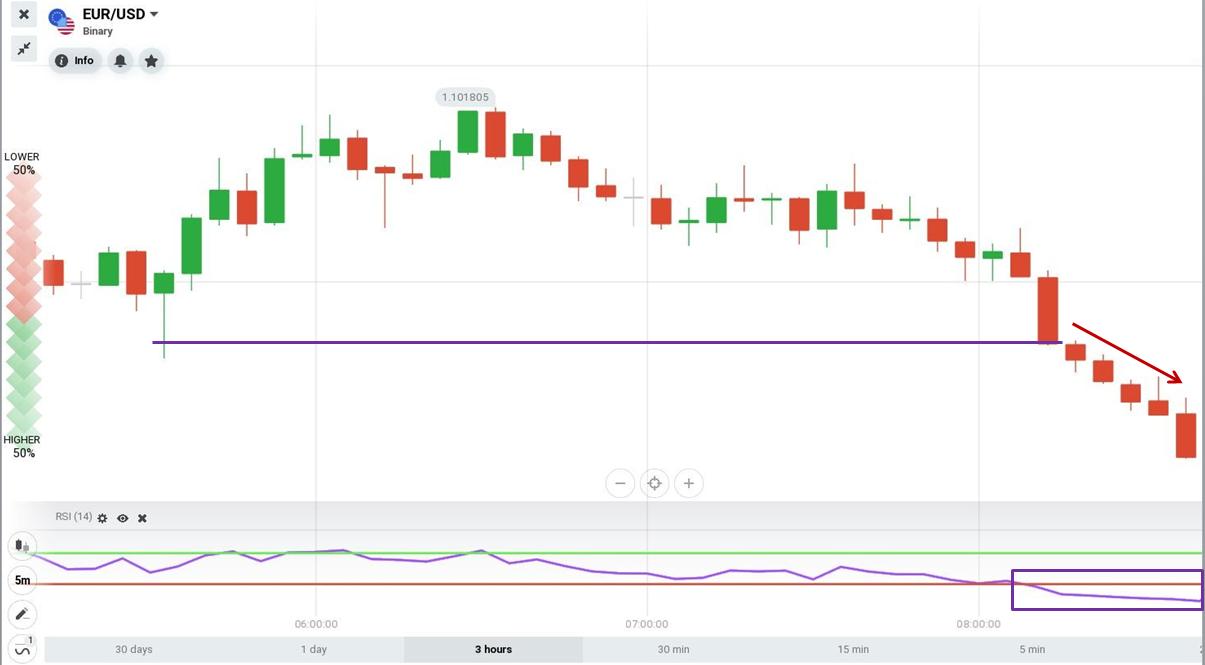
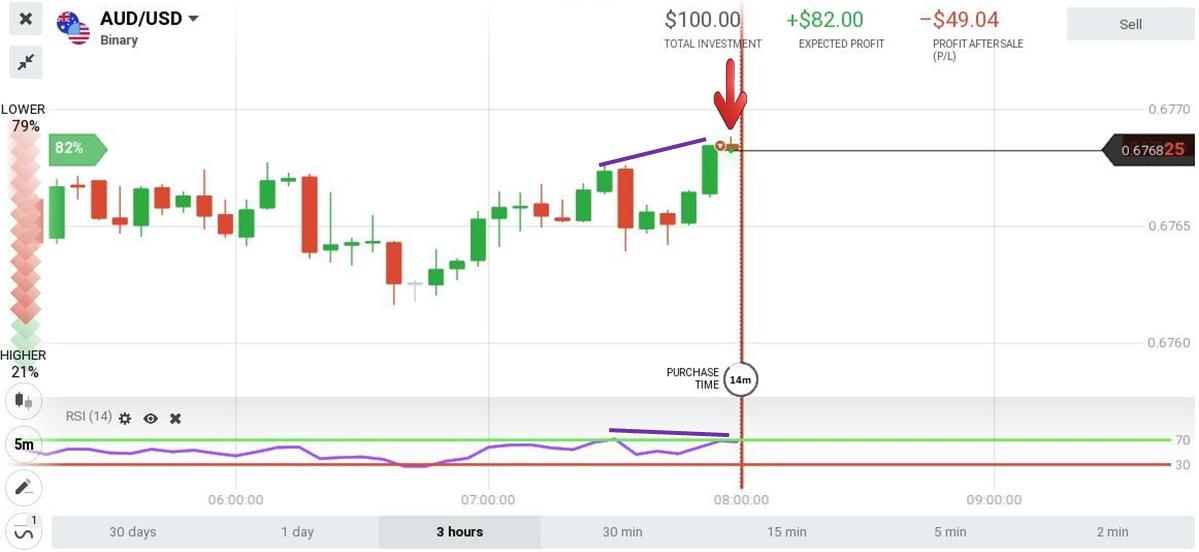
LOWER = The appearance of the bearish divergence.
The trend was up. The price created higher peaks after peaks, but the RSI indicator went down which was against the price => bearish divergence signaled a reversal from up to down => Opened a LOWER order with an expiration time of 15 minutes.
One last word
In general, this is an extremely effective and flexible IQ Option trading strategy when the market is sideways or in a clear trend. We can find a safe entry point when combining the RSI and Support/Resistance indicators.
We will have detailed articles on orders opened with real accounts using this strategy. Thank you for following up.
Register IQ Option and Get Free $10,000 Risk warning: Your capital might be at risk.
Indonesia Português Tiếng Việt ไทย العربية हिन्दी 简体中文 Nederlands Français Deutsch हिन्दी Italiano 한국어 Melayu Norsk bokmål Русский Español Svenska Tamil Türkçe Zulu


