 Indonesia
  Português
  Tiếng Việt
  ไทย
ไทย  العربية
  हिन्दी
  简体中文
简体中文  Nederlands
  Français
  Deutsch
  हिन्दी
  Italiano
  한국어
한국어  Melayu
  Norsk bokmål
  Русский
  Español
  Svenska
  Tamil
Tamil  Türkçe
  Zulu
Zulu
This is for traders who prefer technical analysis indicators and use them as an entry signal. It is flawed not to know the Awesome Oscillator indicator designed to measure the momentum of the market. In this article, let’s learn about what the Awesome Oscillator indicator is and trading strategies using this indicator with us.
Register IQ Option and Get Free $10,000 Risk warning: Your capital might be at risk.
What is the Awesome Oscillator indicator?
Awesome Oscillator (AO) is a graphical indicator, designed to measure market volatility. This indicator was designed and introduced for the first time by Bill Williams, hence it is also called Bill Williams indicator.
Like so many other indicators that have been introduced, the AO is also an indicator used to measure market volatility. This also includes recent fluctuations in exchange rates in the currency market. From there, it forecasts the up or downtrend of the data series or exchange rates, etc. in the coming time.

How to set up Awesome Oscillator indicator
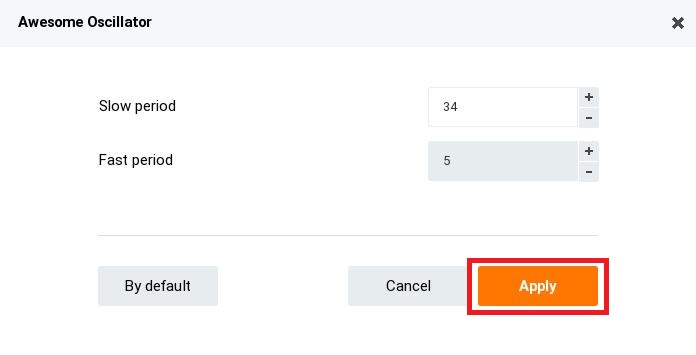
To set up the Awesome Oscillator: Choose “indicator” box -> Tab “Popular” -> Select “Awesome Oscillator”.
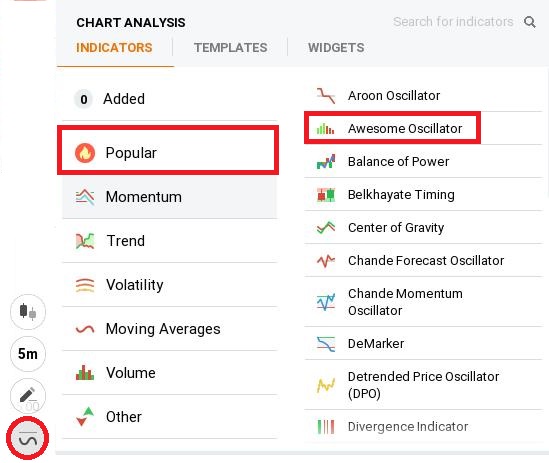
You can customize according to your strategy or use the default setting of IQ Option.
How to use Awesome Oscillator indicator for trading in IQ Option
Basic signals are classified in the corresponding order as follows:
Saucer signal: It appears when the bars reverse (from upwards to downwards). The second bar is lower than the first bar and is red. The third bar is higher than the second bar and is green.
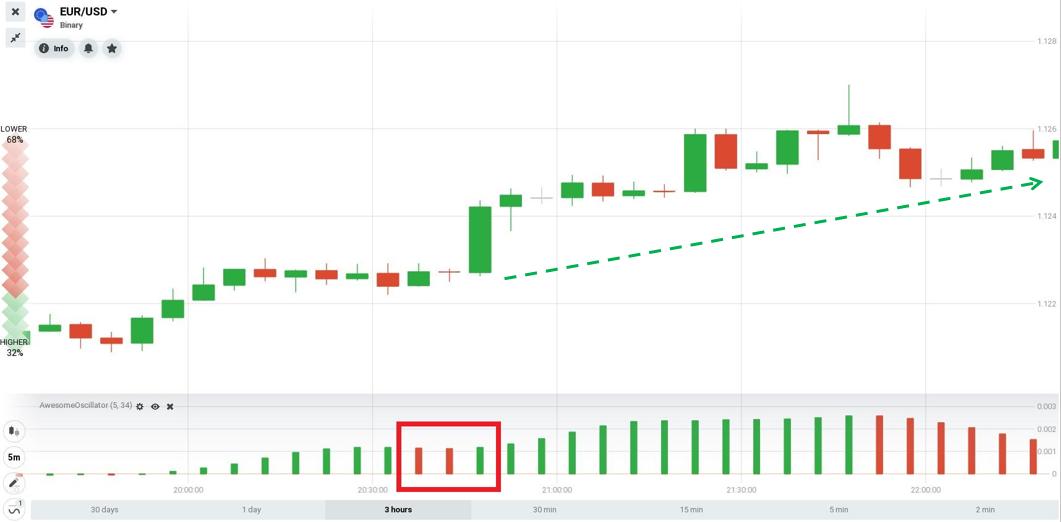
Zero Line Cross signal:
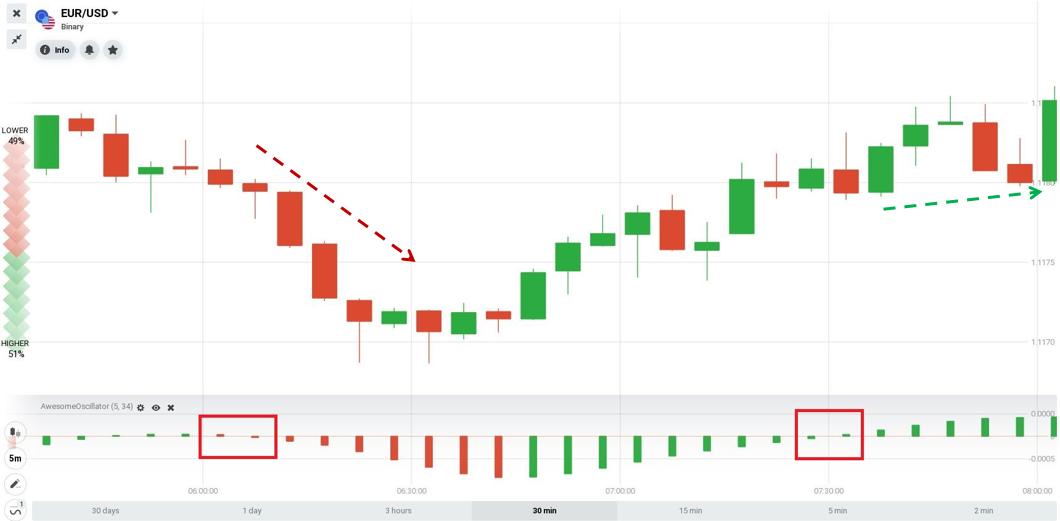
Twin Peaks signal:
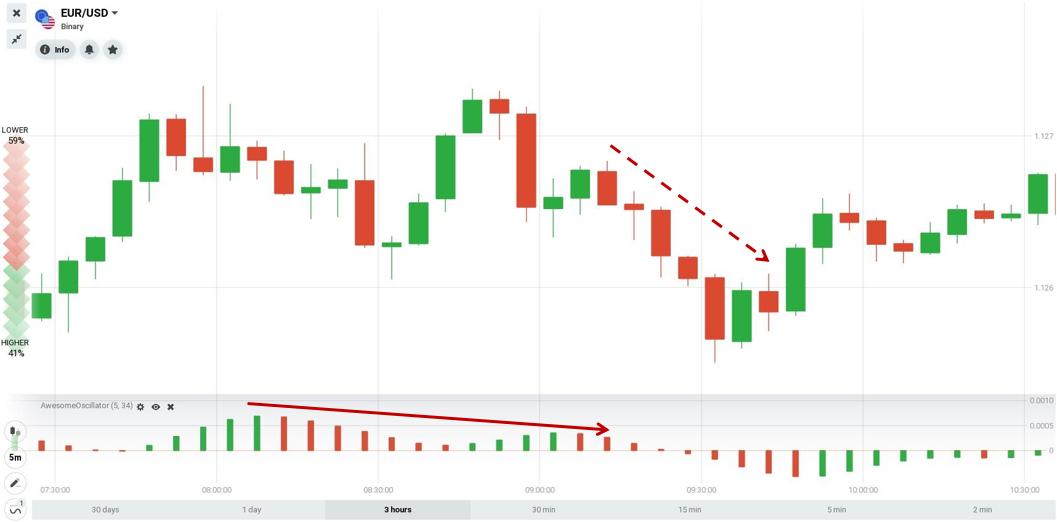
Conversely, we have the Twin Troughs signal:
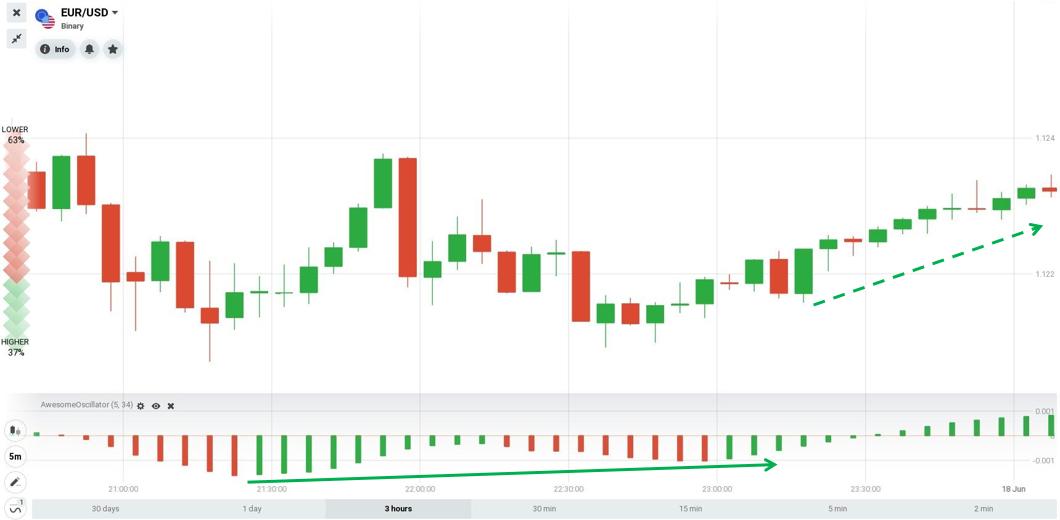
How To Trade Using Awesome Oscillator Indicator
To trade safely, you can rely on the standard Awesome Oscillator pattern.
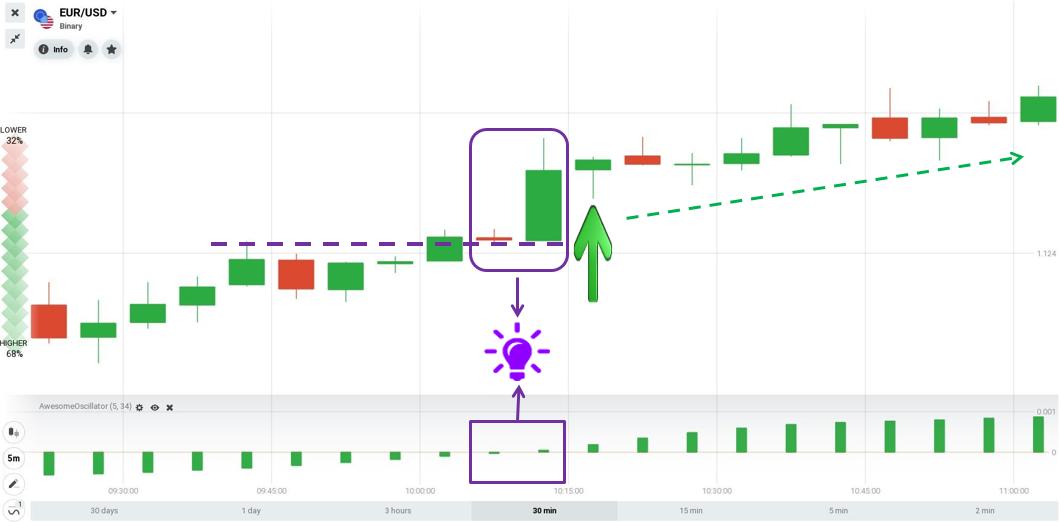
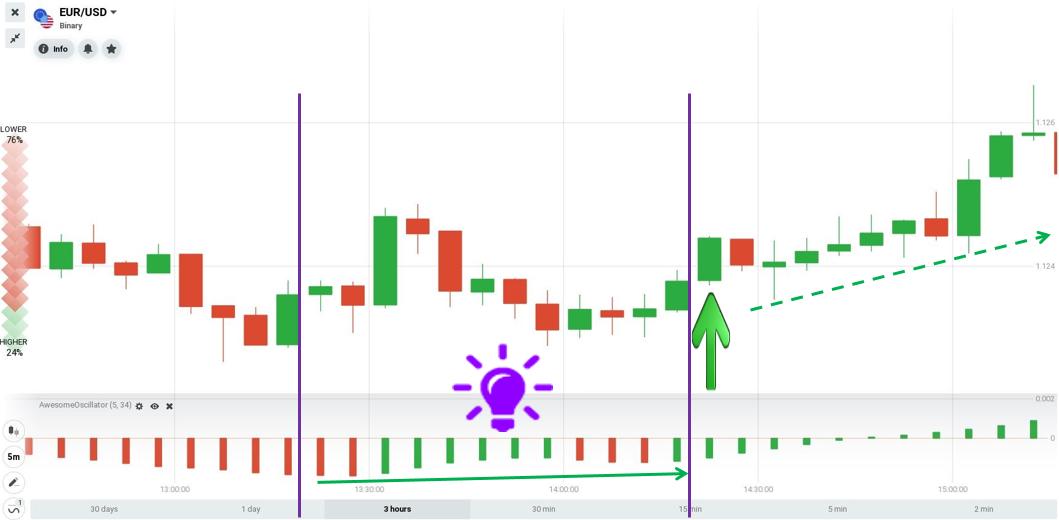
Zero Line Cross
When the graph goes from the negative value zone to the positive value zone, we have a signal to open an UP order.
We just need two bars to confirm the signal. One of the two bars has a negative value and the other has a positive value (rising up from the negative value zone to the positive value zone). The price touches the support and rebounds.
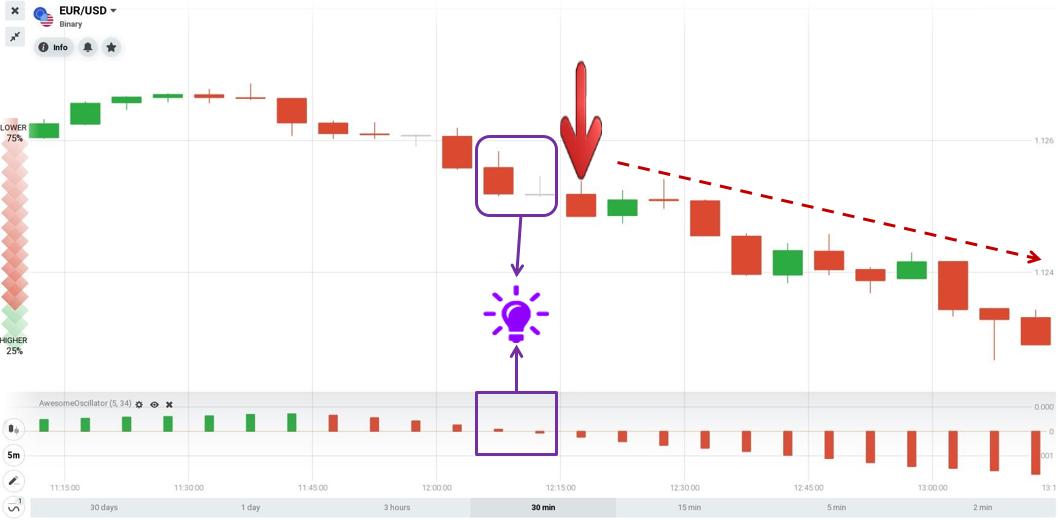
Conversely, we just need 2 bars to cross the Zero Line from above (shifting from the positive value zone to the negative value zone).
Twin peaks and twin troughs
In order to trade with the Twin Peaks pattern effectively, the confirmation is very important. You need to remember as follows:
– It occurs when the highest peak is above the zero line and the next one is a lower one (but still above zero, in other words the second peak is closer to zero).
– The columns between the 2 peaks must also be on the Zero Line. The signal has no effect in case the graph intersects the Zero Line between two peaks.
– Each new peak of the graph must be lower than the previous one (or closer to 0).
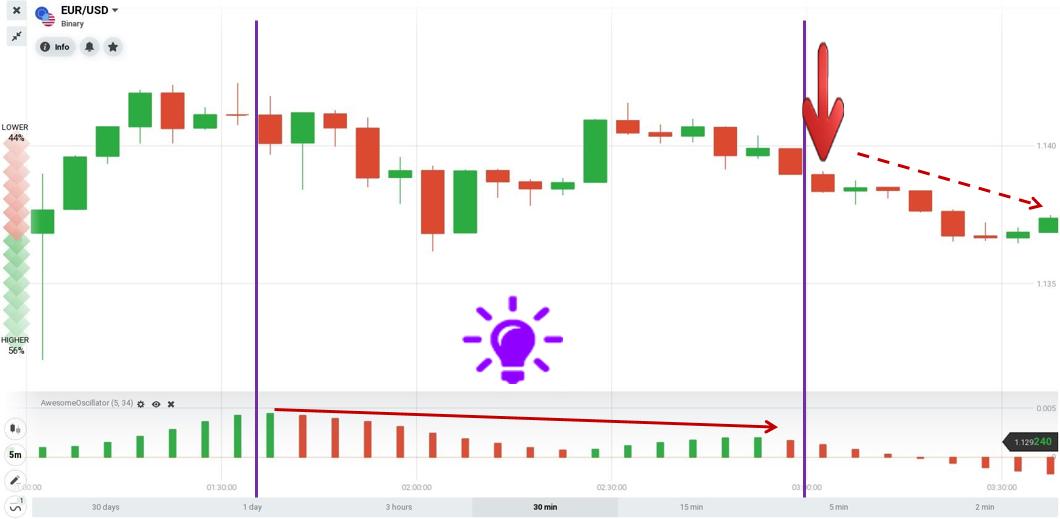
When the AO indicator has formed 2 peaks, open an UP order.
To conclude
This strategy is used by experienced traders to analyze the most detailed. We can say that this is an indicator of the most effective indicator of momentum. You can experience for yourself by trading with a demo account. Once you have a steady profit, start thinking about making real money in IQ Option.
Register IQ Option and Get Free $10,000 Risk warning: Your capital might be at risk.
 Indonesia
  Português
  Tiếng Việt
  ไทย
ไทย  العربية
  हिन्दी
  简体中文
简体中文  Nederlands
  Français
  Deutsch
  हिन्दी
  Italiano
  한국어
한국어  Melayu
  Norsk bokmål
  Русский
  Español
  Svenska
  Tamil
Tamil  Türkçe
  Zulu
Zulu
