Tag: reversal trade
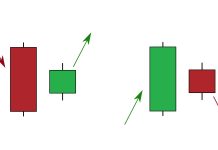
Harami candlestick pattern – How to identify and trade in IQ Option
Harami candlestick pattern is widely known by traders when it appears in the price chart. When it happens, the market trend is very likely to reverse.
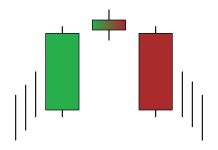
Evening Star candlestick pattern – How to identify and trade it in IQ Option
Evening Star candlestick pattern is often used to find the top of a market trend. By observing only 3 candlesticks, you can understand the price movement.
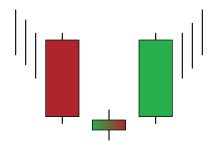
Morning Star candlestick pattern – How to identify and trade it in IQ Option
Morning Star candlestick pattern can sign a high probability of a reversal of the market trend. It is a safe signal for opening options in IQ Option.
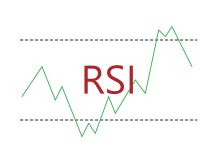
RSI indicator – How to use it and trade in IQ Option
RSI indicator is a tool that measures the degree of price change. It is one of the technical indicators for price and entry points analysis in IQ Option.
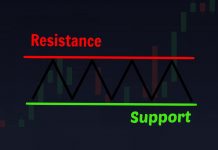
Support and resistance – The best technical indicator when trading in IQ Option
Support and resistance are the two most important indicators in price technical analysis. It is a safe and reliable sign for you to trade.
