Tag: options trading
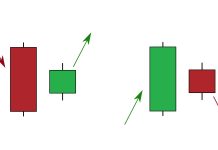
Harami candlestick pattern – How to identify and trade in IQ Option
Harami candlestick pattern is widely known by traders when it appears in the price chart. When it happens, the market trend is very likely to reverse.
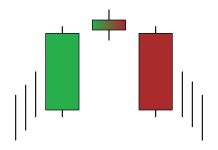
Evening Star candlestick pattern – How to identify and trade it in IQ Option
Evening Star candlestick pattern is often used to find the top of a market trend. By observing only 3 candlesticks, you can understand the price movement.
How to use Weis Wave Volume to trade in IQ Option
Weis Wave Volume (WWV) is a reliable indicator widely used by Brazillian traders in IQ Option. This indicator can identify the main trend of the market.
MACD indicator – How to identify it and trade in IQ Option
MACD is one of the most popular technical indicators used to identify trends of the market price. Today I will build IQ Option trading strategies around it.
Bollinger Bands indicator – How to use it and trade in IQ Option
Bollinger Bands are one of the most useful technical indicators when trading options. Many traders use it as a guideline to buy options in IQ Option
Did IQ Option manipulate prices to scam traders’ money?
Most traders are worried that IQ Option broker might manipulate prices on the night of Tuesday (Nov 11). At that time, a lot of long shadow candlesticks abnormally appeared....
How to choose the best trading products in IQ Option
There are a lot of products for you to choose in IQ Option. However, not many products are profitable. In this article, we will introduce you to some trading products that are the most potential for earning money.
What is Binary Options? Is it possible to make money from trading Options?
Basically, Options is a half-blood child between financial investment and gambling. What exactly is Options? Is it a trading channel in the financial field?


