 Indonesia
  Português
  Tiếng Việt
  ไทย
ไทย  العربية
  हिन्दी
  简体中文
简体中文  Nederlands
  Français
  Deutsch
  हिन्दी
  Italiano
  한국어
한국어  Melayu
  Norsk bokmål
  Русский
  Español
  Svenska
  Tamil
Tamil  Türkçe
  Zulu
Zulu
Bollinger Bands is certainly not a strange name in the trading world. Many famous trading strategies are using this indicator in IQ Option. One of them is about to be shared with you in the most detail. The strategy that I will introduce in this article has received a lot of attention from traders around the world, which is originally named New Bollinger Bands. Let’s explore this interesting strategy together!
Register IQ Option and Get Free $10,000 Risk warning: Your capital might be at risk.
How to set up the New Bollinger Bands strategy
- Platform: IQ Options or any platform with a 5-second candlestick chart.
- Indicator: Bollinger Bands default setting (20,2) on both time frames.
- Timeframe: Simultaneous setup of M1 and 5-second charts
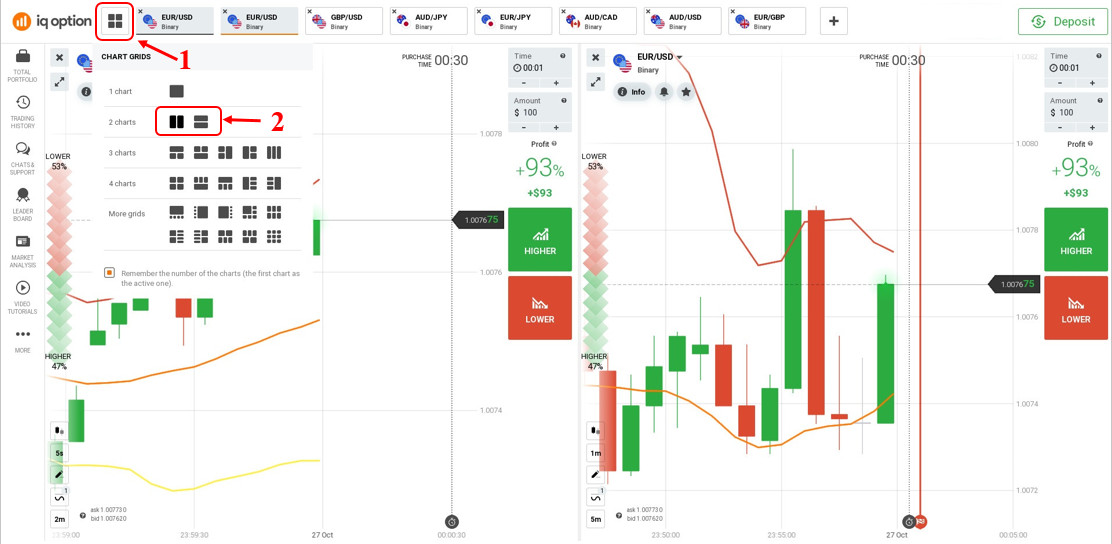
Although this strategy is simple, its setup seems a bit confusing. You will have to open 2 charts of the same product you want to trade on the screen at the same time. Both of these charts must have Bollinger Bands.

New Bollinger Bands strategy trading rules
Once completing the setup, we’ll come to the trading rules. They are also not very complicated with the following
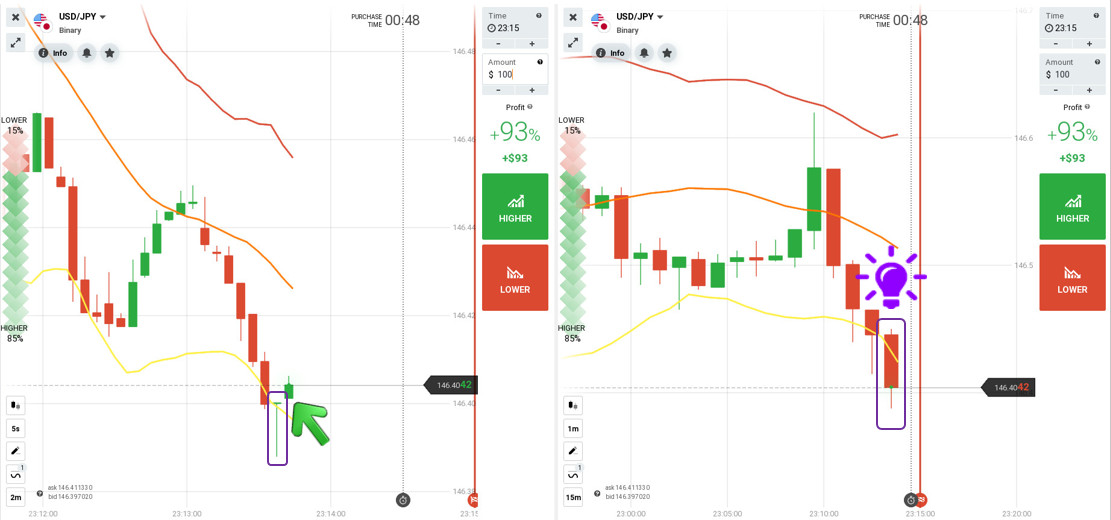
Rules for entering HIGHER orders: wait for the price to fall to the lower bands of the Bollinger Bands in both charts. Then you wait for the candle on the 5-second chart to show a strong increase with 1 candle popping up, then you can enter a HIGHER 30s or 1-minute order.

In the picture above, we can see the 5s chart has 1 Dragonfly Doji candle. That shows a strong increasing force and the 1-minute chart is also outside the lower band. So, it is eligible to open a HIGHER order most safely.
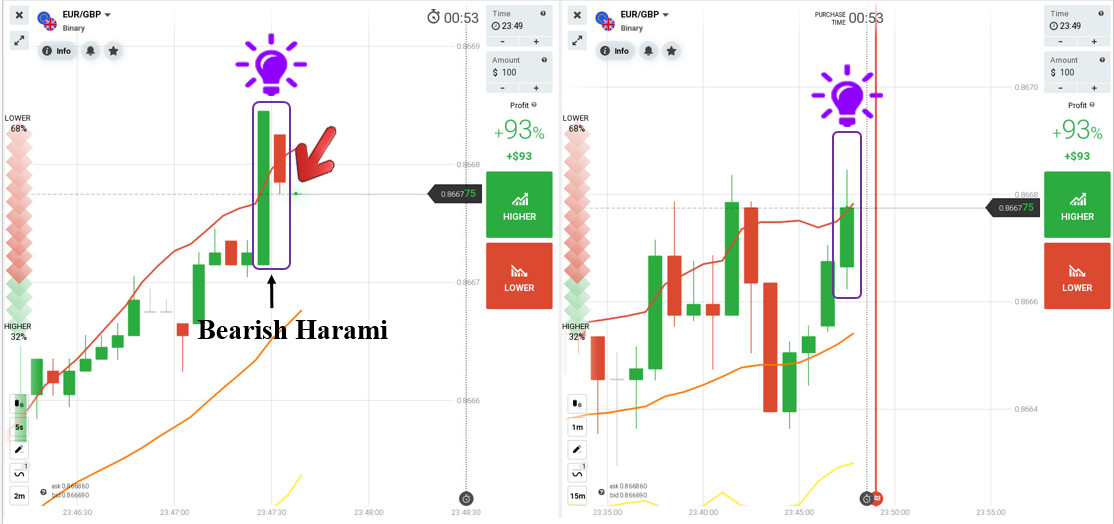
Rules for entering LOWER orders: wait for the price to break above the upper bands of the Bollinger bands in both charts. Then you wait for the candle on the 5-second chart to show a strong downward force with a long candle strengthening the downtrend. You can enter a LOWER 30s or 1-minute order.

As the example above, you can see the 5-second chart had a very strong bullish candle beyond the upper band. Then the bearish candle gaped inside the body of the previous bullish candle, forming a Bearish Harami candlestick pattern. That signaled that the price was about to reverse from up to down. And in the 1-minute chart, the price broke out of the upper band and then pulled out. So you can open a LOWER order immediately.
Summary
I have a note on the trading rules of this strategy. You need a little knowledge of price action to choose a strong bullish or bearish confirmation candle. This candle is really important. Because if it shows too little force, maybe the trade will fail. Just think of it as a breakout candle for easy visualization.
This is one of the trading strategies under 60 seconds that I find really effective. Although the strategy is not difficult to apply, you still need a bit of price action knowledge to find powerful candlesticks to get quality trades.
Register IQ Option and Get Free $10,000 Risk warning: Your capital might be at risk.
 Indonesia
  Português
  Tiếng Việt
  ไทย
ไทย  العربية
  हिन्दी
  简体中文
简体中文  Nederlands
  Français
  Deutsch
  हिन्दी
  Italiano
  한국어
한국어  Melayu
  Norsk bokmål
  Русский
  Español
  Svenska
  Tamil
Tamil  Türkçe
  Zulu
Zulu


