

![]()
![]()
![]()
![]()
![]()
![]()
![]()
![]()
![]()
![]()
![]()
![]()
![]()
![]()
![]()
![]()
![]()
![]()
![]()
![]()
![]()

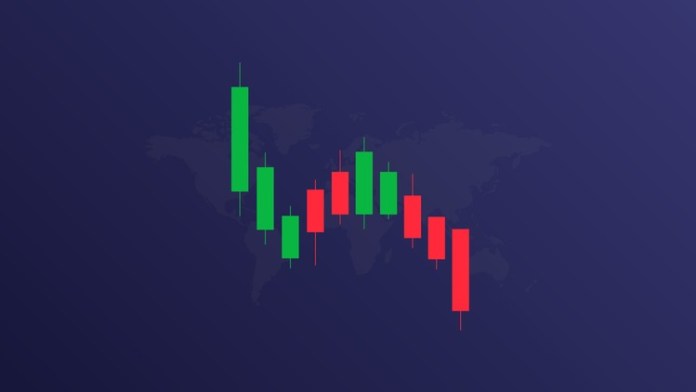
This is one of the ways to make money in IQ Option with extremely effective long-time options. Heiken Ashi is a candlestick, but it has more features than ordinary Japanese candlesticks. It helps you identify major market trends and provide safe and effective entry points.
Let’s learn how Heiken Ashi candlestick pattern works and build trading strategies with it in IQ Option.

Register IQ Option and Get Free $10,000 Risk warning: Your capital might be at risk.
What is Heiken Ashi candlestick?
Heiken Ashi candlestick (as known as HA candlestick) means “average candlestick”. It is a very special type of candlestick. In appearance, the color is no different from Japanese candlesticks. But the calculation to create a candlestick, Heiken Ashi is very different. Its most important part is the average value.

The formula is as below.
(1) HA candlestick opening price = Average closing and opening price of the previous HA candlestick = (Previous HA opening price + Previous HA closing price)/2.
(2) HA candlestick closing price = Average price of closing, opening, highest and lowest of the current candlestick = (Opening price + Closing price + Highest price + Lowest price)/4.
(3) HA candlestick top = choose the highest level among 3 levels including Highest price, HA opening price or closing price.
(4) HA candlestick bottom = choose the lowest level among 3 levels namely Lowest price, HA opening price or closing price.
How does Heiken Ashi candlestick pattern work?
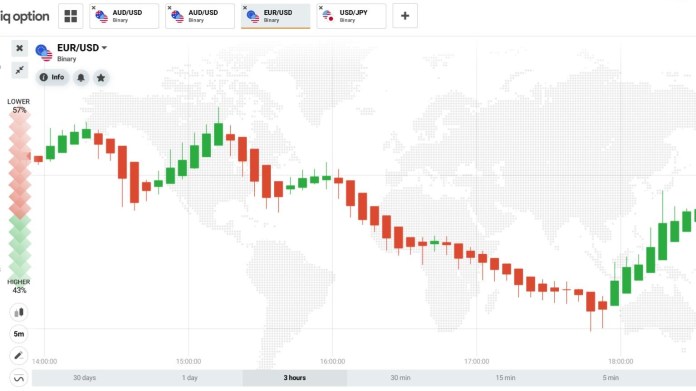
Because of the above calculation, when observing Heiken Ashi candlestick chart in IQ Option, you will see like this.

(1) When the price falls (downtrend), the red candlesticks will line up closely. The next HA candlestick will open from the middle of the previous candlestick. Current closing price will be lower than the closing one of the previous candlestick. At the same time, the candlestick shadow usually points downwards.
(2) When the price rises (uptrend), the green candlesticks will stand next to each other. The next HA candlestick will open from the middle of the previous green candlestick. Current closing price will be higher than the closing one of the previous candlestick. The candlestick shadow also points upwards.
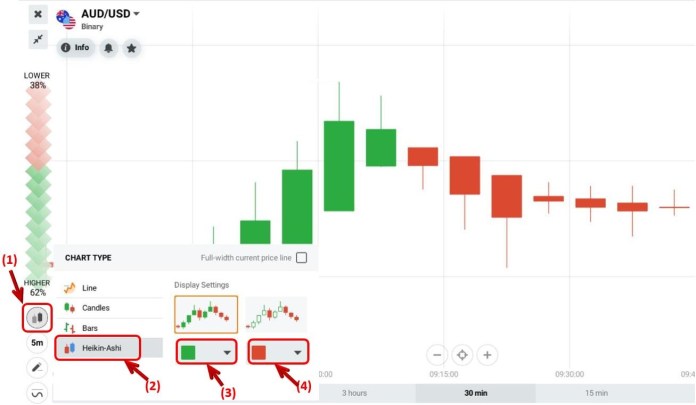
How to set up Heiken Ashi candlestick pattern in IQ Option
(1) Click Chart in IQ Option => (2) Choose Heiken Ashi => (3) Customize color for bullish candlesticks to green => (4) Change color for bearish candlesticks to red.

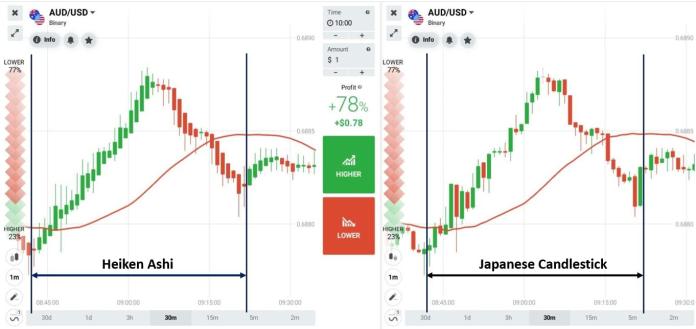
The difference between Japanese candlesticks and Heiken Ashi candlesticks
| Heiken Ashi candlestick | Japanese candlestick | |
| Popularity | Not many people use because most of them don’t fully understand its using | Used by most traders in the world |
| Chart | Opening and closing price are quite complicated. So you need to learn the formula and understand its structure | Opening and closing price are easy to understand |
| Trend forecast | Mid-term and long-term | Short-term and mid-term |
| Using | Filter out bad signals. Very effective in long-term trade when the trend is formed cleary. | Effective when using in short-term trade to capture price fluctuations |

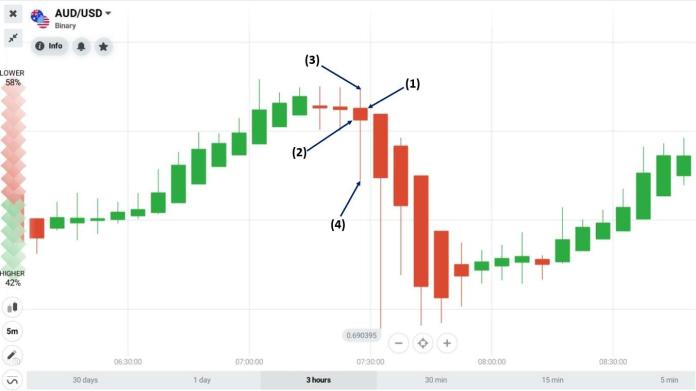
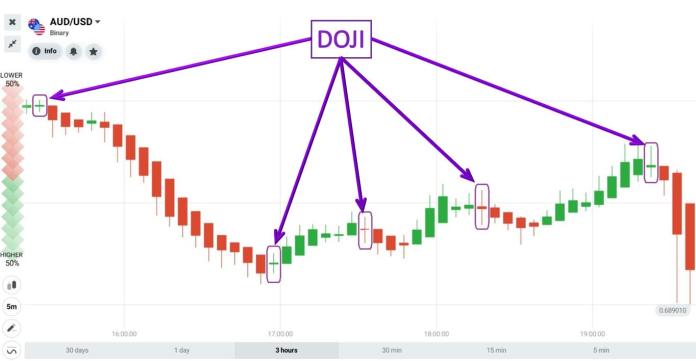
Reversal signals of Heiken Ashi
Heiken Ashi creates Doji candlesticks
As same as Japanese candlesticks, when Heiken Ashi creates a Doji, it shows the market limbo. It is the signal that the main trend is likely to stop and reverse. Therefore, when using Heiken Ashi, you must focus on Doji candlesticks.

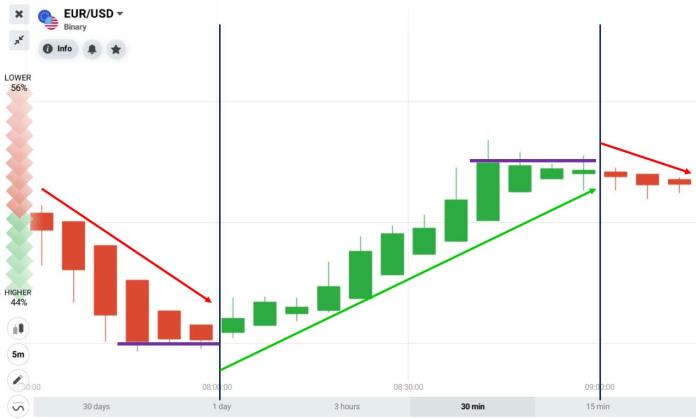
Heiken Ashi shows slowing-down signs
It also means that the prices show signs of slowing down.
For example, when red candlesticks have closing prices that are equal or higher than the closing price of the previous candlestick => the trend is likely to reverse from downtrend to uptrend. On the contrary, when green candlesticks’ closing prices are equal or lower than the previous candlestick’s closing one => the trend tends to reverse from uptrend to downtrend.

IQ Option trading strategy with Heiken Ashi candlesticks
Our IQ Option trading strategy will be to Identify the main trend > Find signals to open options.
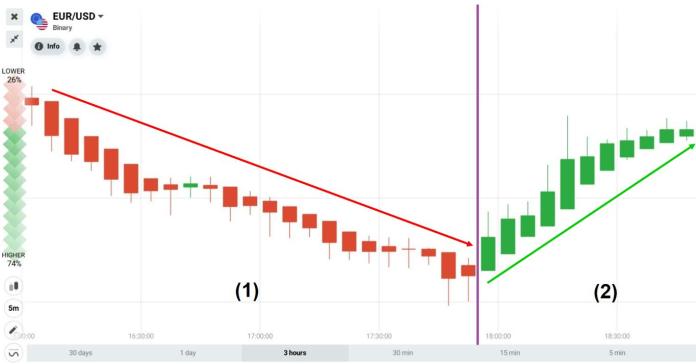
With Heiken Ashi candlestick pattern, you can identify the main trend of the market easily. When HA is green => only open HIGHER options. Conversely, when HA is red => only open LOWER options.
Now it’s time to combine Heiken Ashi with indicators or candlestick patterns to find signals to buy options.
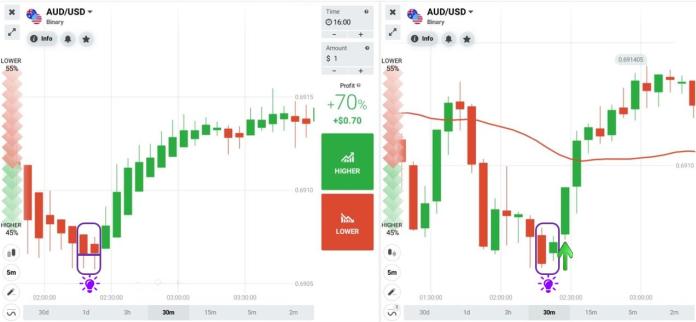
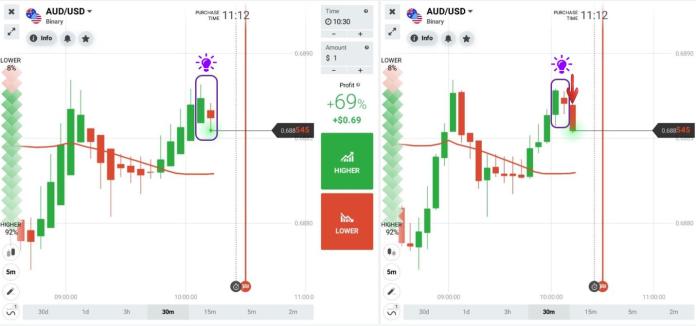
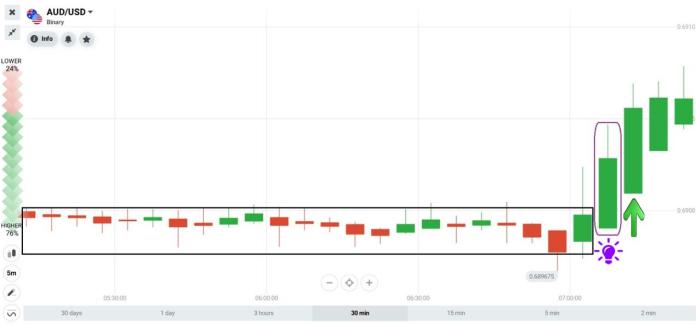
The meaning of icons on the picture:

Lamp icon is a signal to open a trade (option).
The green arrow icon is to open a Higher option when the signal has just ended.
The red arrow icon is to open a Lower option.
Strategy 1: Use both Japanese candlestick charts and Heiken Ashi candlestick charts
For this trading method, you need to open 2 parallel tabs for 1 currency pair. Use Heiken Ashi to identify trends. And use Japanese candlesticks to find entry points.
How to open two candlestick charts in IQ Option

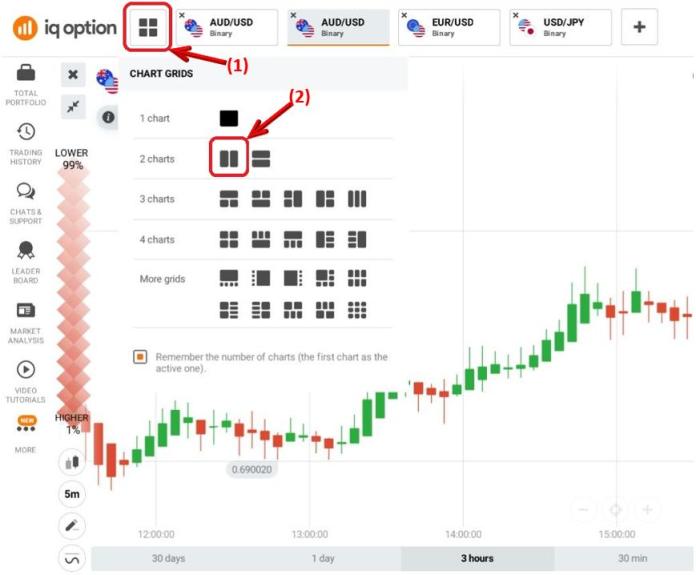
Requirements: 5-minute HA candlestick chart and 5-minute Japanese candlestick chart. The expiration time is 15 minutes.
Trading technique:
HIGHER = HA shows signs of reversing the trend from downtrend to uptrend + Bullish Harami candlestick pattern.

LOWER = HA shows signs of reversing the trend from uptrend to downtrend + Bearish Harami candlestick pattern.

You can be flexible when using Japanese reversal candlestick patterns. It’s not necessarily Harami. They can be Morning Star, Evening Star or Pin Bar.

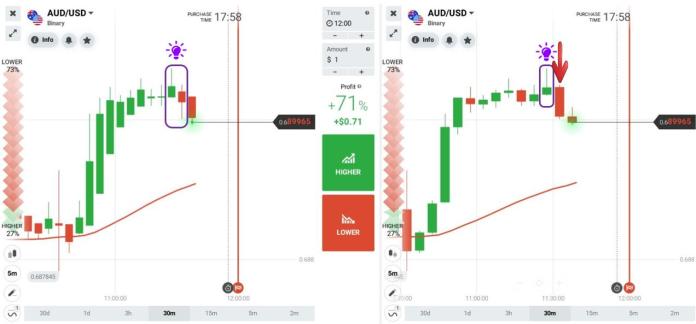
Strategy 2: Heiken Ashi candlestick pattern combines with RSI indicator
We will combine the reversal signs of Heiken Ashi candlestick pattern in oversold or overbought zones.
Requirements: 1-minute Heiken Ashi candlestick pattern + RSI indicator. The expiration time is 5 minutes.
Trading technique:

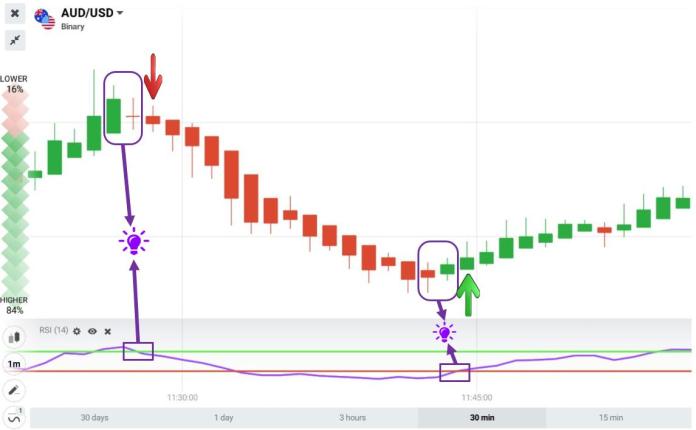
HIGHER = Heiken Ashi reverses from downward to upward trend + RSI moves up from below the oversold zone and cuts 30.
LOWER = Heiken Ashi reverses from upward to downward trend + RSI moves down from above the overbought zone and cuts 70.
Strategy 3: Exploding entry point with Heiken Ashi candlestick pattern
This is the IQ Option trading method with the highest winning rate. Open options when the price breaks the sideways period and flies like a rocket.
For example, the price is moving sideways, creating Heiken Ashi red and green candlesticks alternating. But “BOOM”. It escapes the sideways period, increases sharply and creates green candlesticks. This is a strong uptrend => Open HIGHER options.
Summary
Through the above article, we see that Heiken Ashi candlestick is very useful when trading with trend. If we know how to use the strengths of each indicator in each appropriate time, the results are always good. You should try Demo in IQ Option account to test interesting strategies like Heiken Ashi to have good trading methods for yourself.
Register IQ Option and Get Free $10,000 Risk warning: Your capital might be at risk.
![]()
![]()
![]()
![]()
![]()
![]()
![]()
![]()
![]()
![]()
![]()
![]()
![]()
![]()
![]()
![]()
![]()
![]()
![]()
![]()
![]()