Tag: iq option entry point
Harami candlestick pattern – How to identify and trade in IQ Option
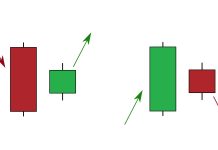
Harami candlestick pattern is widely known by traders when it appears in the price chart. When it happens, the market trend is very likely to reverse.
Support and resistance – The best technical indicator when trading in IQ Option
Support and resistance are the two most important indicators in price technical analysis. It is a safe and reliable sign for you to trade.


