
 Indonesia
  Português
  Tiếng Việt
  ไทย
ไทย  العربية
  हिन्दी
  简体中文
简体中文  Nederlands
  Français
  Deutsch
  हिन्दी
  Italiano
  한국어
한국어  Melayu
  Norsk bokmål
  Русский
  Español
  Svenska
  Tamil
Tamil  Türkçe
  Zulu
Zulu
Highly secure trading orders do not come from a single indicator. It is made up of two or three indicators combined. Fibonacci is no exception although it is considered the most perfect indicator in finding profits on IQ Option. In this article, I will show you how to combine the Fibonacci indicator with support and resistance to trade more accurately.
Register IQ Option and Get Free $10,000 Risk warning: Your capital might be at risk.
Why combine the Fibonacci indicator with support/resistance when trading IQ Option
Despite Fibonacci being a very effective trading tool, using it alone may not give you the wanted results. So I choose to combine it with support and resistance to increase the accuracy to the highest level. At the same time, identifying support/resistance levels is not too difficult for beginners. So it can be widely applied and suitable for all investors.

Fibonacci levels are set according to the available series of numbers. We combine them with the price zones where traders are waiting to buy or sell (support and resistance zones). The possibility of a bounce from these zones will be much higher.
Specific examples
This is a daily candlestick chart of the EUR/USD currency pair. As you can see, this pair is trending up. We will wait for the BUY entry. So where are we going to BUY? Fibonacci will answer this question when drawn from the lowest to the highest peak.
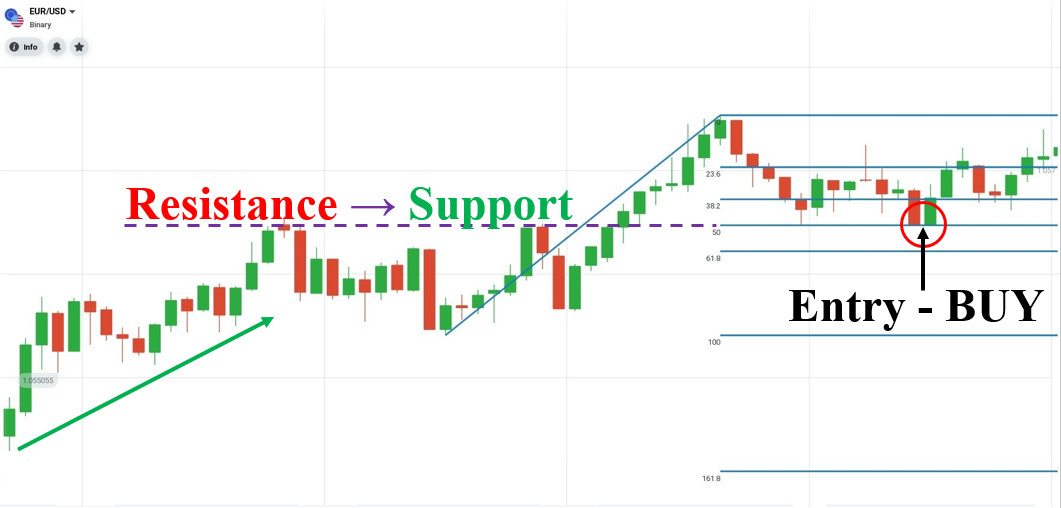
Looking at the chart above, we will find the resistance zone converted into support. It coincides with the 50% Fibonacci, which is a very nice BUY price.
If you place a BUY order in the 50% zone, then it is the right decision. Let’s see the next touch of the price in this zone. The price tried to penetrate that level but could not close the candle below. Finally, the price bounced and broke the old peak, continuing the previous uptrend.
Why is this happening?
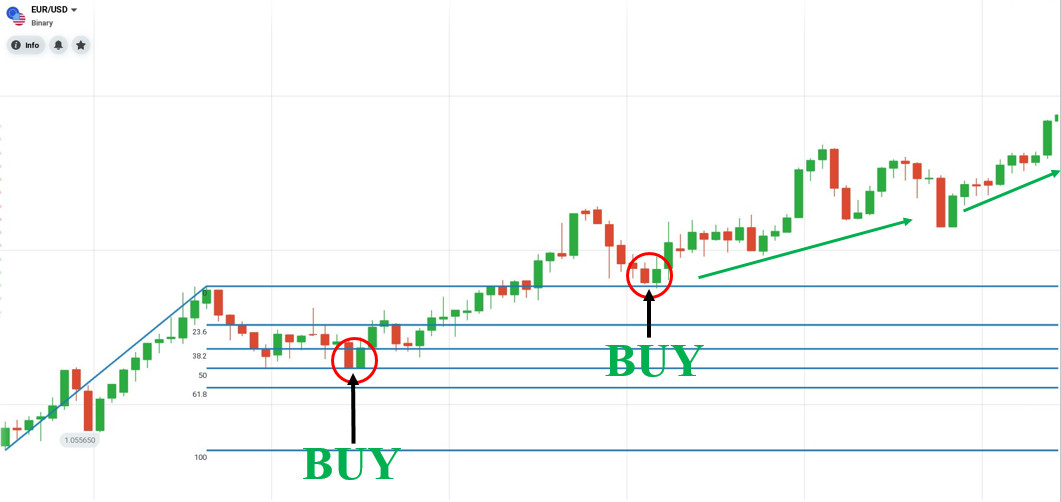
First, every trader knows that old support/resistance levels are good places to open a BUY or SELL order because other traders will be focusing on these zones too.
Second, we must know that many professional traders or large funds also use the Fibonacci indicator to find buy and sell points in those safe zones. If combined with both support and resistance, it is clear that there will be a lot of buy orders in those areas. Then the price might go as we expected with a positive cash flow.

Of course, there is no guarantee that the price will bounce back in the zone we analyze. But at least, we are prepared to execute our trades with confidence. Remember that trading is based on probability, nothing is 100% certain. So we need to choose for ourselves the entry points with a high winning rate by analyzing the market.
How to trade properly when combining Fibonacci indicator with support and resistance
Step 1: Determine the lowest low and highest high to draw the exact Fibonacci.
Step 2: Find the 50 series. Especially, it should be near the support or resistance level.
Step 3: Wait for the price to return to the waiting zone to place a BUY/SELL order in IQ Option.
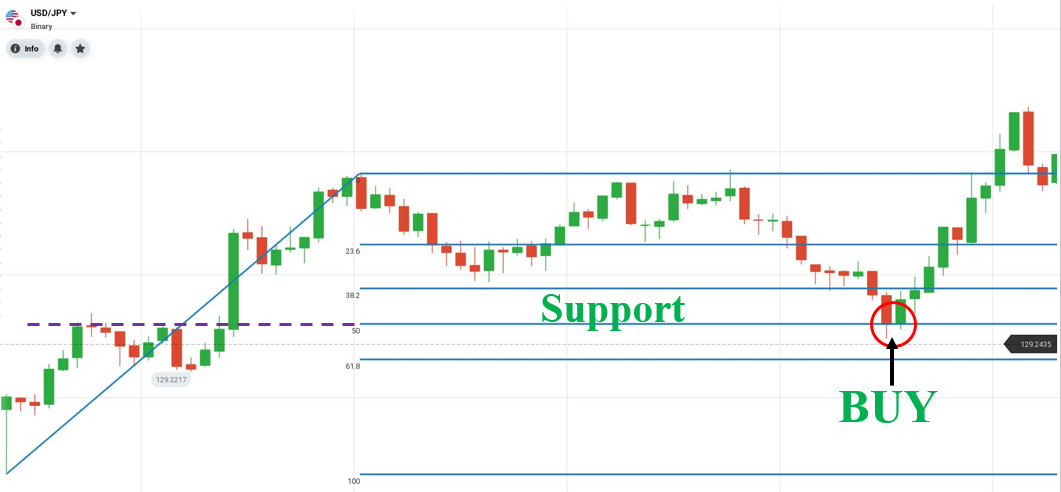
Open a BUY order when the uptrend at Fibonacci 50 is close to the previous support zone.
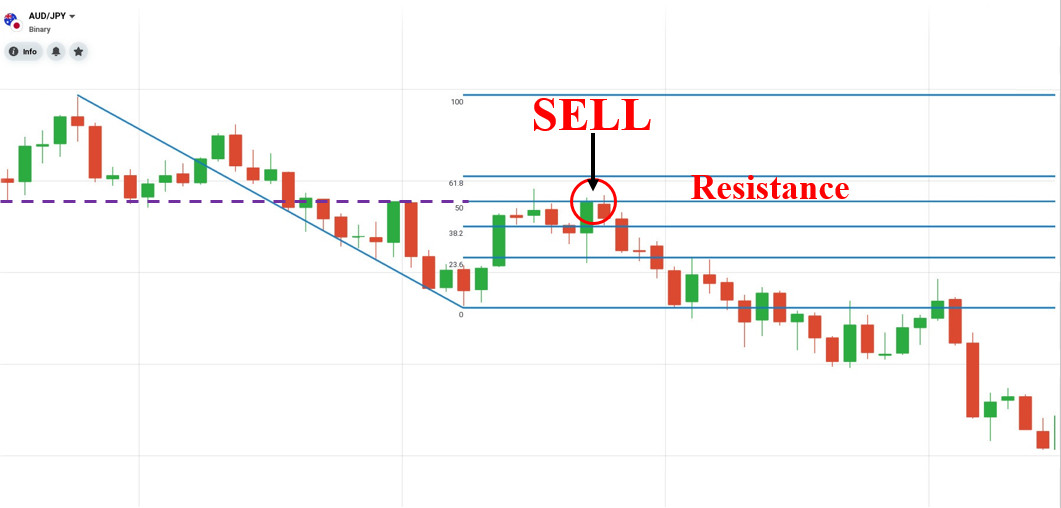
Place a SELL order when the downtrend at Fibonacci 50 coincides with the nearest resistance zone.
This indicator is useful in identifying entry points at support and resistance levels. However, choosing the timeframe, peak, and trough to draw Fibonacci lines is not simple. It depends on the investor’s point of view. So you must always improve your knowledge and practice more skills when using it.
Above is the whole process to have the most standard strategy with support/resistance and Fibonacci. Hopefully, through this article, everyone has understood and successfully applied this strategy in forex and options trading. Thank you for reading.
Register IQ Option and Get Free $10,000 Risk warning: Your capital might be at risk.
Indonesia Português Tiếng Việt ไทย العربية हिन्दी 简体中文 Nederlands Français Deutsch हिन्दी Italiano 한국어 Melayu Norsk bokmål Русский Español Svenska Tamil Türkçe Zulu


