
![]()
![]()
![]()
![]()
![]()
![]()
![]()
![]()
![]()
![]()
![]()
![]()
![]()
![]()
![]()
![]()
![]()
![]()
![]()
![]()
![]()

In the previous article, I showed you how to use the Fibonacci indicator to find the most basic support/resistance zones to open orders there. Today, we will add one more condition to increase safety before opening orders. That is the appearance of reversal candlestick patterns at the price points that return to the 50 – 61.8 Fibonacci zone. Let’s find out more details in this article.
Register IQ Option and Get Free $10,000 Risk warning: Your capital might be at risk.
Benefits of the combination of Japanese candlestick pattern and Fibonacci indicator
When combining Fibonacci with candlestick patterns, we need to find reversal ones. Because they have many advantages to support the Fibonacci indicator.
- Help investors catch the top and bottom through the retracement point of Fibonacci. From there, optimize profits compared to signals that only use technical indicators.
- The Japanese candlestick pattern clearly shows the future price trend. In addition, it also provides signals to be able to recognize the upcoming trend of the price.
- The Japanese candlestick pattern is easy to recognize for new investors entering the market.

How to combine the Fibonacci indicator with the Japanese candlestick pattern
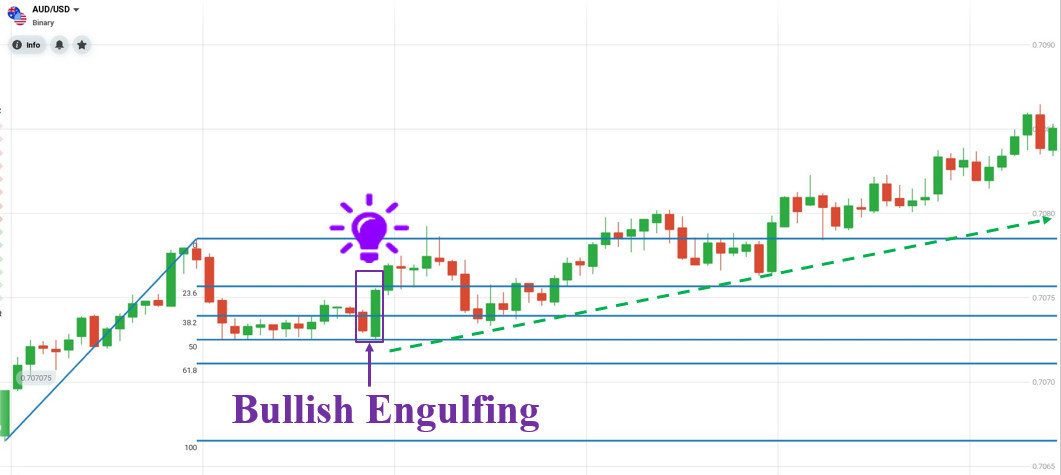
Taking the AUD/USD currency pair in an uptrend as an example, we see the price retracing to the 50 zone of the Fibonacci. The price couldn’t continue to fall when there were many small-bodied Doji candles showing indecision. After that, the Bullish Engulfing candlestick pattern was formed, signaling the price to reverse from bearish to bullish.

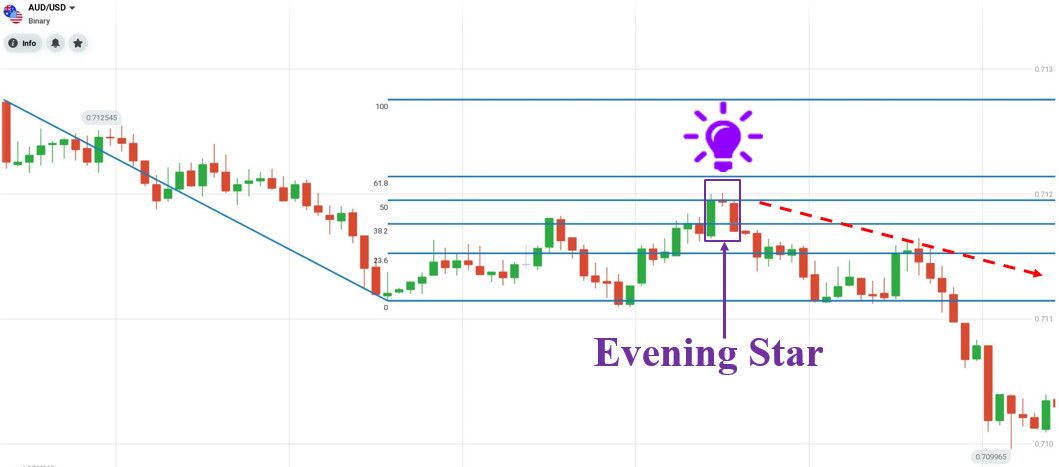
It’s still the AUD/USD currency pair but this time in a downtrend. The price was retracing to the 50 Fibonacci zone and forming an Evening Star pattern there, signaling a price reversal from bullish to bearish.

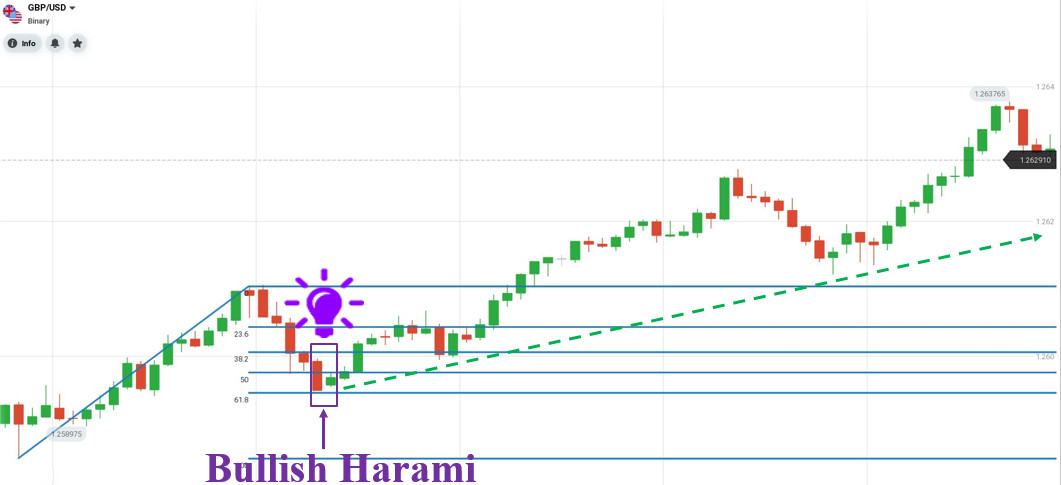
Next is the GBP/USD currency pair, which was trending up. Suddenly, the price dropped rapidly and strongly to the 61.8 zone of the Fibonacci, creating a Bullish Harami pattern showing that the price is about to reverse from bearish to bullish.

Conclusion
Through the above 3 examples, you have partly seen the effectiveness of this combination. In practice, you will encounter many similar cases. Generally, they are just the basic things summed up as follows.
- The uptrend is back to the Fibonacci 50 – 61.8 + The bearish-to-bullish reversal candlestick pattern.
- The downtrend corrects to the Fibonacci 50 – 61.8 + The bullish-to-bearish reversal candlestick pattern.
The difficult thing here is that you need to understand the characteristics, and how to trade each reversal candlestick pattern. You don’t need to find the tutorials anywhere else because, in the education section, we introduce you to many basic but highly accurate candlestick patterns. You just need to read and remember how to handle them when encountering them on the chart. Wish you successful trading with this combination.
Register IQ Option and Get Free $10,000 Risk warning: Your capital might be at risk.
![]()
![]()
![]()
![]()
![]()
![]()
![]()
![]()
![]()
![]()
![]()
![]()
![]()
![]()
![]()
![]()
![]()
![]()
![]()
![]()
![]()