
![]()
![]()
![]()
![]()
![]()
![]()
![]()
![]()
![]()
![]()
![]()
![]()
![]()
![]()
![]()
![]()
![]()
![]()
![]()
![]()
![]()

Price Action traders consider Tweezer candlestick pattern as a precise reversal pattern. In this article, I will guide you on how to identify Tweezer candlestick pattern. And how to use it to trade options in IQ Option.
Register IQ Option and Get Free $10,000 Risk warning: Your capital might be at risk.
What is Tweezer candlestick pattern?
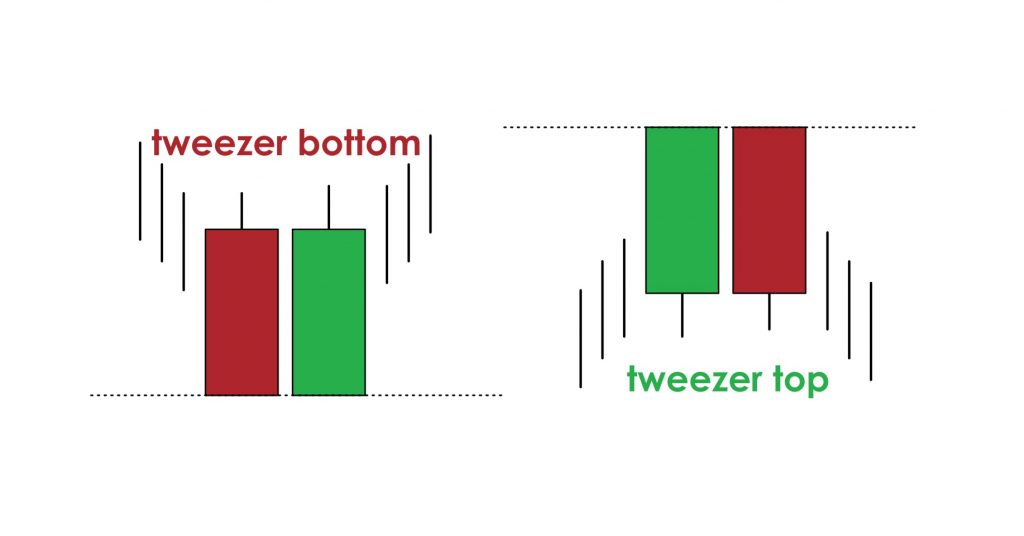
Tweezer candlestick pattern (also known as tweezer top/tweezer bottom) is a reversal candlestick pattern. It usually appears at the top or bottom of an upward or downward price trend. It is made up of two long candlesticks with opposite colors and almost the same length. This is considered as a reversal signal during IQ Option trading.

How does Tweezer candlestick pattern work?
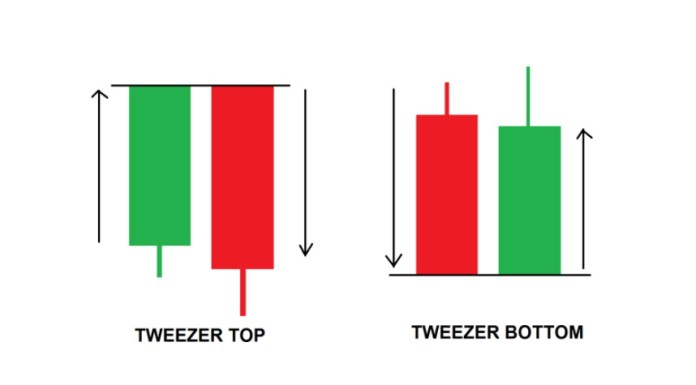
Tweezer Tops
Tweezer tops is a pattern of two candlesticks appearing at the end of an uptrend.
• The first candlestick is green. It is longer than previous candlesticks, which shows that the price has increased sharply.
• The second candlestick is red. It is almost as long as the green candlestick. Its opening price is equal to the closing price of the first candlestick. The price has suddenly fallen. This is a signal that the trend reversal from upward to downward.

Tweezer Bottoms
Tweezer Bottoms is a candlestick pattern that appears at the end of a downtrend.
• The first candlestick is red, which has an equivalent length compared to previous candlesticks. It shows that the price is falling sharply.
• The second candlestick is green. It has the opening price equal to the closing price of the first candlestick. Its length is almost equal to the previous red candlestick. The price has suddenly reversed from decreasing to increasing.

IQ Option trading strategy with Tweezer candlestick pattern
Tweezer candlestick pattern is a reversal candlestick pattern. So it should combine with other reversal indicators. The purpose is to increase accuracy when trading in IQ Option.
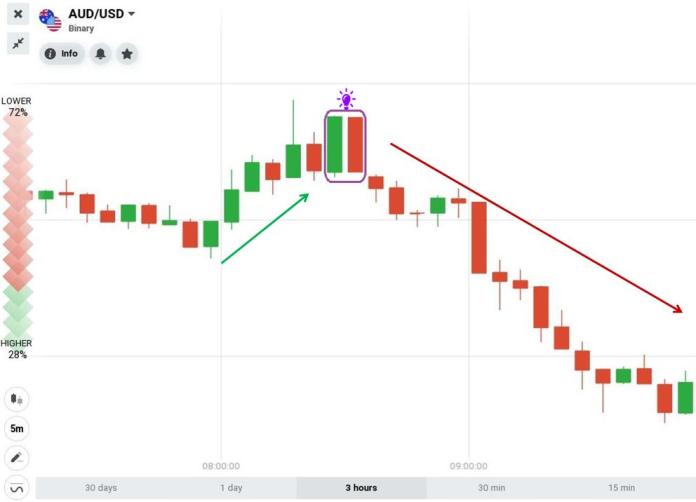
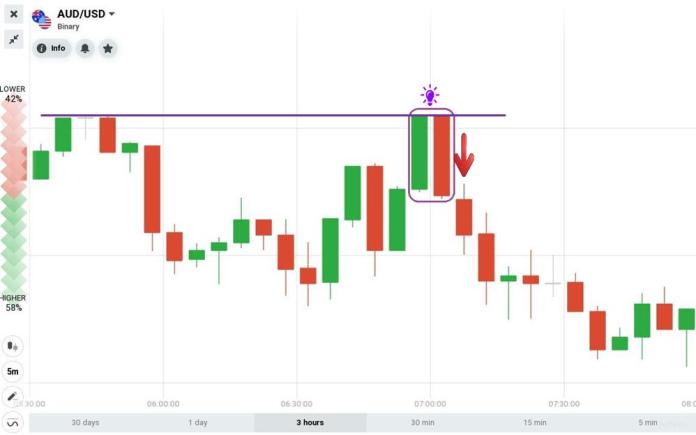
Strategy 1: Use Tweezer candlestick pattern in combination with support and resistance level
Requirements: 5-minute Japanese candlestick chart + Tweezer candlestick pattern. The expiration time is 15 minutes.
Trading guide:
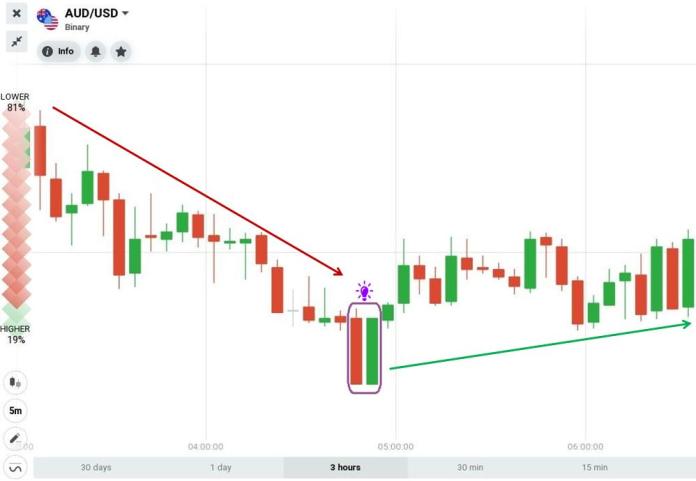
HIGHER = Tweezer Bottoms candlestick pattern and support level.

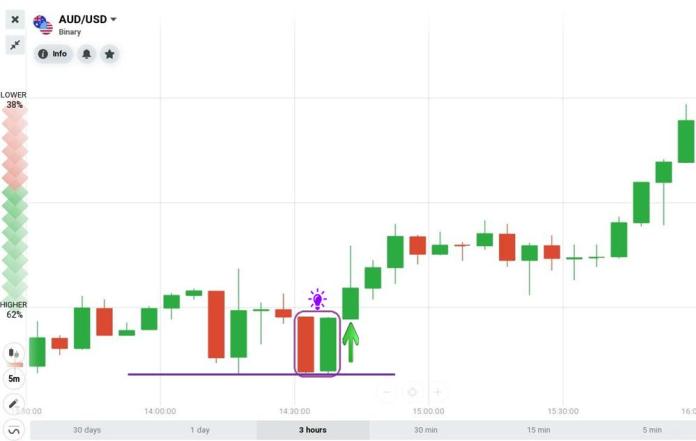
LOWER = Tweezer Tops and resistance level.

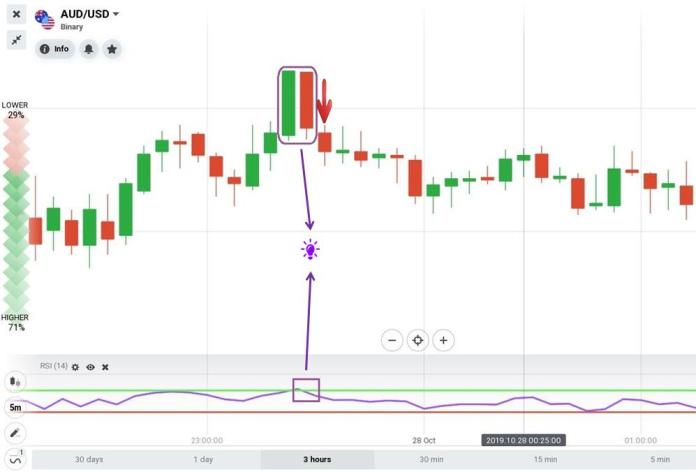
Strategy 2: Use Tweezer candlestick pattern in combination with RSI indicator
RSI indicator is an effective indicator that can identify market trends precisely. It also shows trend reversal points. That’s why it is suitable for combining with Tweezer candlestick pattern.
Requirements: Japanese 5-minute candlestick chart + Tweezer candlestick pattern + RSI indicator. The expiration time is 15 minutes.
Trading guide:
HIGHER = Tweezer Bottoms candlestick pattern and RSI in the oversold zone.

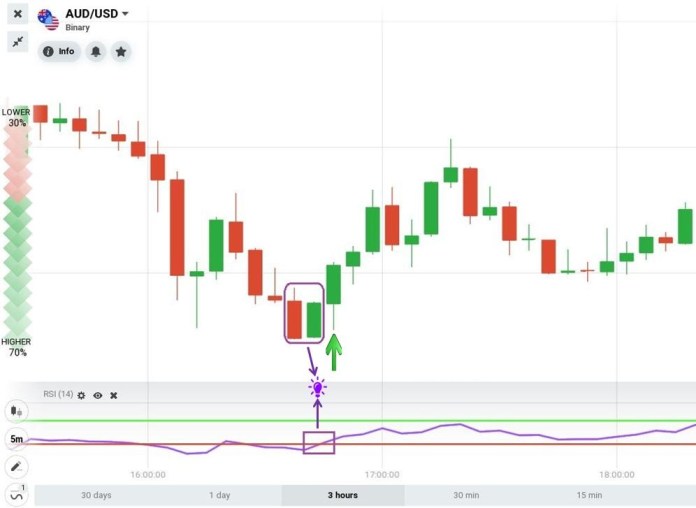
LOWER = Tweezer Tops candlestick pattern and RSI in the overbought zone.

Conclusion
Tweezer candlestick pattern can combine with a variety of indicators. I will introduce to you these strategies in the next articles. Please register for a demo account in IQ Option to experience these candlestick patterns. Good luck!
Register IQ Option and Get Free $10,000 Risk warning: Your capital might be at risk.
![]()
![]()
![]()
![]()
![]()
![]()
![]()
![]()
![]()
![]()
![]()
![]()
![]()
![]()
![]()
![]()
![]()
![]()
![]()
![]()
![]()