 English
  Indonesia
  Português
  Tiếng Việt
  ไทย
ไทย  العربية
  हिन्दी
  简体中文
简体中文  Nederlands
  Français
  Deutsch
  हिन्दी
  Italiano
  한국어
한국어  Melayu
  Norsk bokmål
  Русский
  Svenska
  Tamil
Tamil  Türkçe
  Zulu
Zulu
Support and resistance are the two most important indicators in price technical analysis. It is a safe and reliable sign for you to trade. In this article, I will guide how to identify and trade with support and resistance in IQ Option.
Registre IQ Option y obtenga $10,000 gratis Risk warning: Your capital might be at risk.
What is support/resistance?
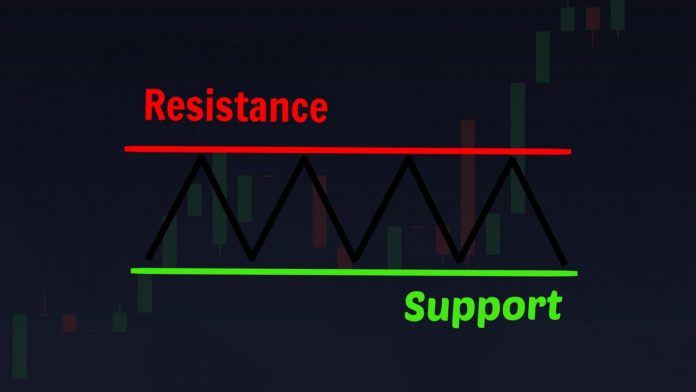
Support and resistance are two price levels where traders expect it to reverse. These are also called psychological thresholds or price action in chart analysis. They repeat again and again, which creates a trading habit and good entry points for traders.
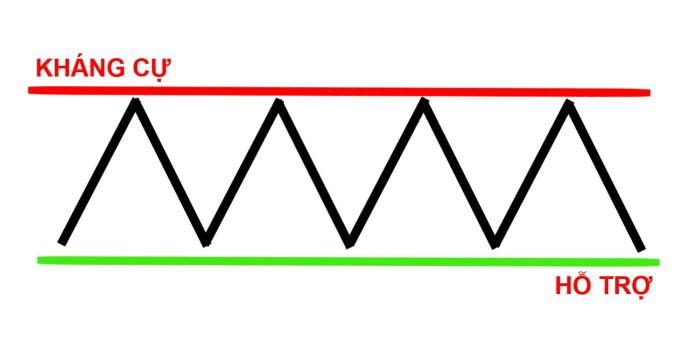
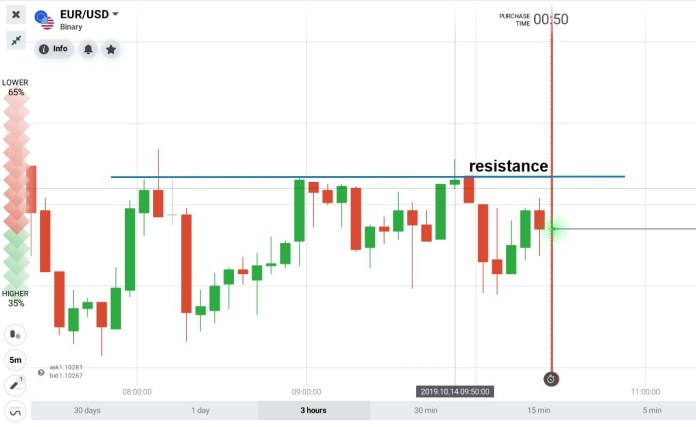
Resistance is created from previous top price levels. The price often rises and goes back to the old peak, then touches the resistance zone. If it is the case, there will be a high probability that the price will reverse and go down.
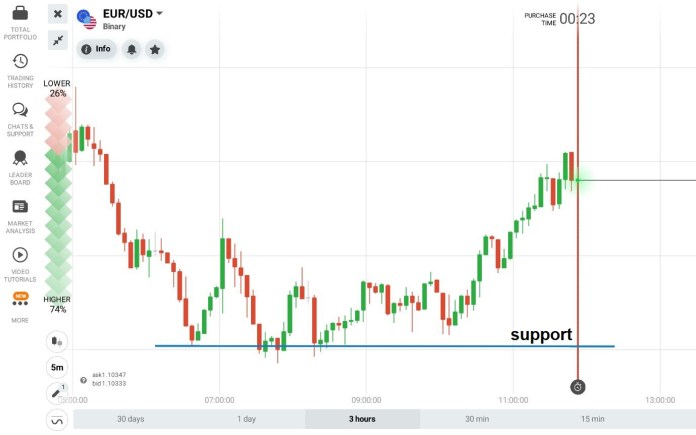
On the contrary, support is created from previous bottom price levels. And when the price falls, goes back to the old bottom then touches the support zone, it tends to reverse and go up.
Important rules of support and resistance
Support and resistance levels: Support/resistance is not a specific point or price. It is a price range.
Strong support/strong resistance: The price range made from many bottoms is called the strong support zone. The price range made from many tops is called the strong resistance zone.
The price can break out support/resistance at any time. After that, their 2 functions will be replaced for each other. Old support becomes new resistance. And vice versa, old resistance becomes new support.
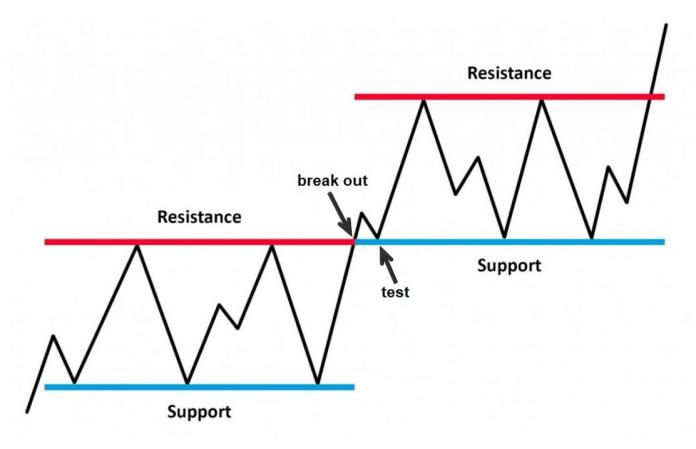
During the increase and decrease processes, the price creates many temporary tops and bottoms. Therefore, it also forms different support/resistance zones.
How to draw support and resistance in IQ Option
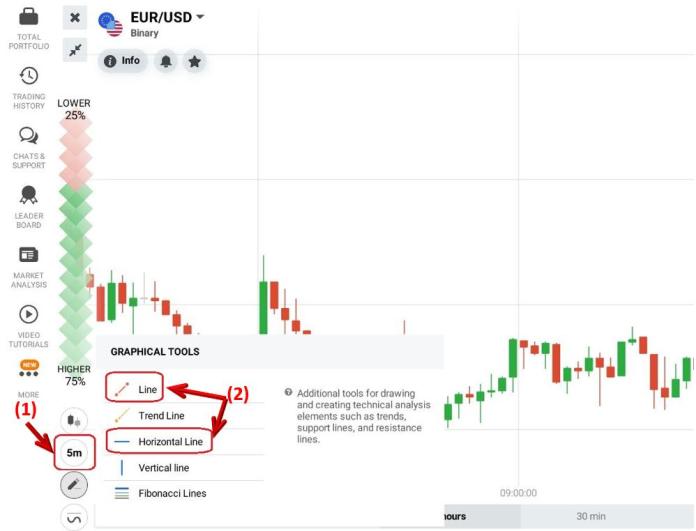
You can use horizontal lines to draw or identify support/resistance in IQ Option.
From a previous top, you can draw a resistance line.
From a previous bottom, you can draw a support line.
How to identify support and resistance zones
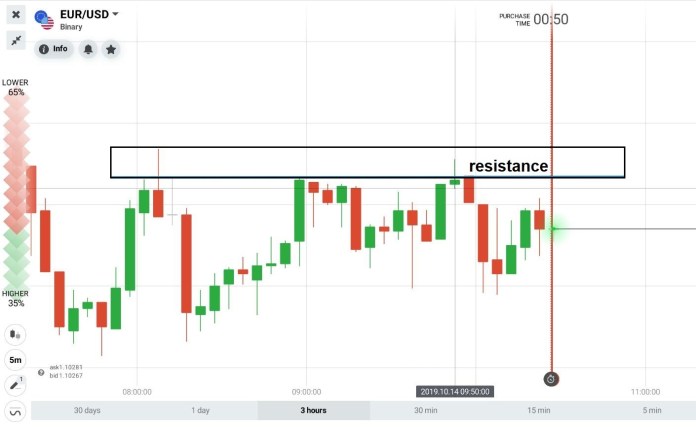
Firstly, this is a price range.
For example, this is the strong resistance zone (made from triple tops). If the price is still moving slowly in this zone, it is going into resistance => The probability of a reversal is relatively high.
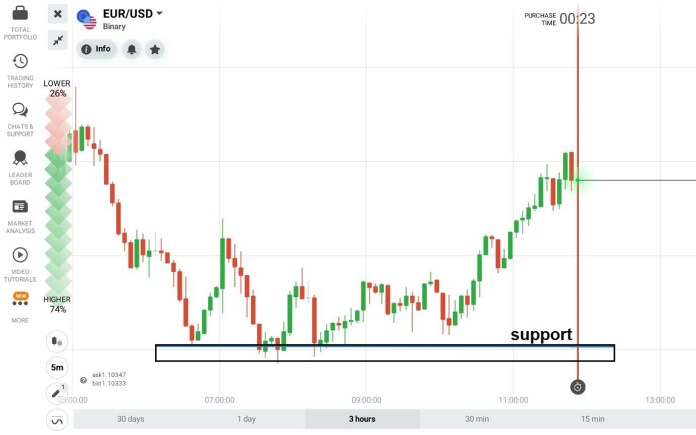
This is a bottom zone (support zone). When the price enters this area, there is a high chance that it will rebound.
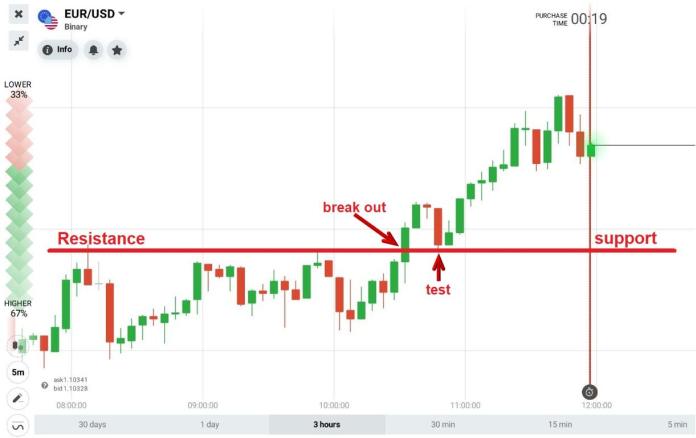
Secondly, support/resistance can swap with each other.
The price increases sharply and breaks out of the resistance area and continues to rise. At this point, the old resistance level will become a new support level. If the price goes back to retest and touches this new support zone, it’s a high chance that it will increase.
IQ Option trading strategy with support and resistance
Support/resistance is just a signal for you to trade. Therefore, it is necessary to have reasonable strategies to trade effectively in IQ Option.
Major currency pairs are EUR/USD, AUD/USD and USD/JPY together with the 5-minute Japanese candlestick chart.
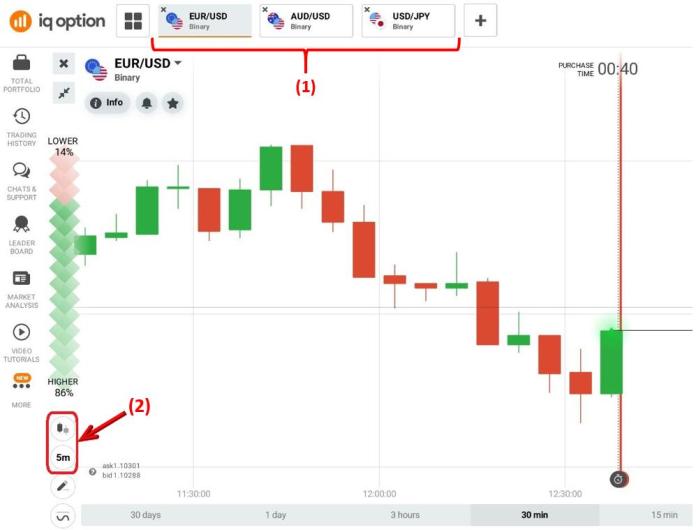
Formula: The price enters the support zone=> open a HIGHER option. Conversely, the price enters the resistance zone => buy a LOWER option.
There are many ways to choose the expiration time of an option according to the above formula.
Trading with candlestick colors
If you do not understand what IQ Option trading based on the color of the candlestick is, please read the following article. Instructions on how to enter the IQ Option command according to the candle color.
For example, the price goes in the support level and creates a red candlestick => Bet the next candlestick green. At this time, if you are using the 5-minute Japanese candlestick chart, then the expiration time = the time the candlestick you bet closes = 5 minutes.
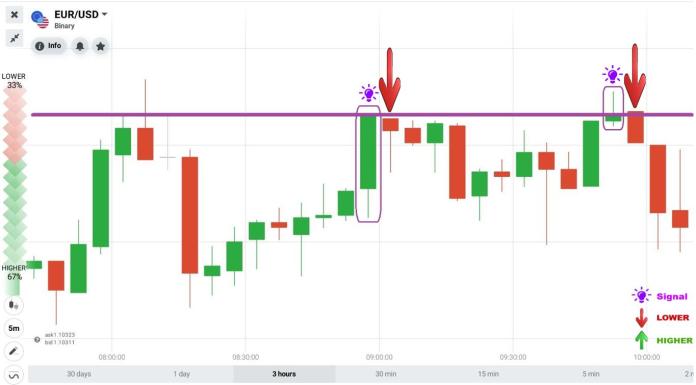
On the other hand, the price touches the resistance zone and creates a green candlestick => Bet the next candlestick red.
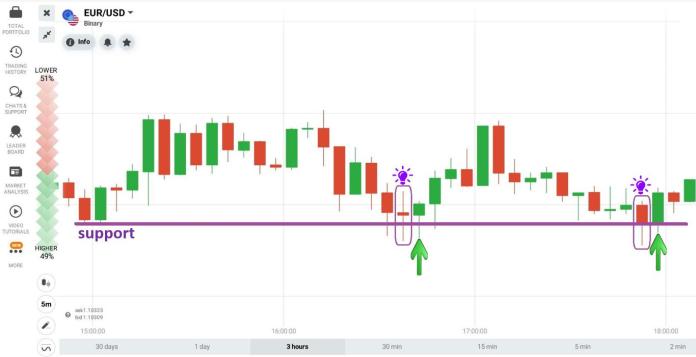
Trading with price action
As soon as the price enters the support or resistance zone, you can open an option. Usually, with this trading technique, you can set the expiration time longer than the Japanese candlestick time. This is a long-time trade.
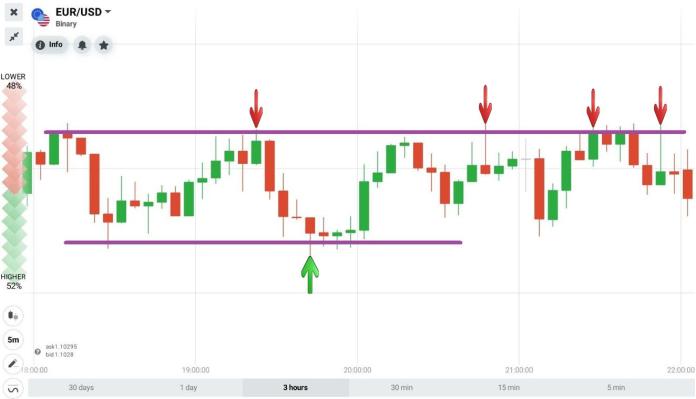
It means when you observe the 5-minute candlestick pattern, you can open options from 10 to 15 minutes. Because after entering the support or resistance level, the price may not reverse immediately. You need a longer time for the price to reverse. That’s why you need to set a longer expiration time.
Capital management when trading with support and resistance indicators in IQ Option
When the price moves in a support or resistance level, you should only open 1 reversal option there. Don’t open options continuously as well as increase the trading capital for the following options.
Only from 1 to 3% of the total capital for each option. For example, if your IQ Option account has $200, then the amount of each option should only be from $2 to $6.
Combine with candlestick patterns
Click to see detailed articles:
– Spinning Top + Support/resistance.
– Hammer candlestick pattern + Support/resistance.
– Shooting Star candlestick pattern + Support/resistance.
Registre IQ Option y obtenga $10,000 gratis Risk warning: Your capital might be at risk.
 English
  Indonesia
  Português
  Tiếng Việt
  ไทย
ไทย  العربية
  हिन्दी
  简体中文
简体中文  Nederlands
  Français
  Deutsch
  हिन्दी
  Italiano
  한국어
한국어  Melayu
  Norsk bokmål
  Русский
  Svenska
  Tamil
Tamil  Türkçe
  Zulu
Zulu
