
 English
  Indonesia
  Português
  ไทย
ไทย  العربية
  हिन्दी
  简体中文
简体中文  Nederlands
  Français
  Deutsch
  हिन्दी
  Italiano
  한국어
한국어  Melayu
  Norsk bokmål
  Русский
  Español
  Svenska
  Tamil
Tamil  Türkçe
  Zulu
Zulu
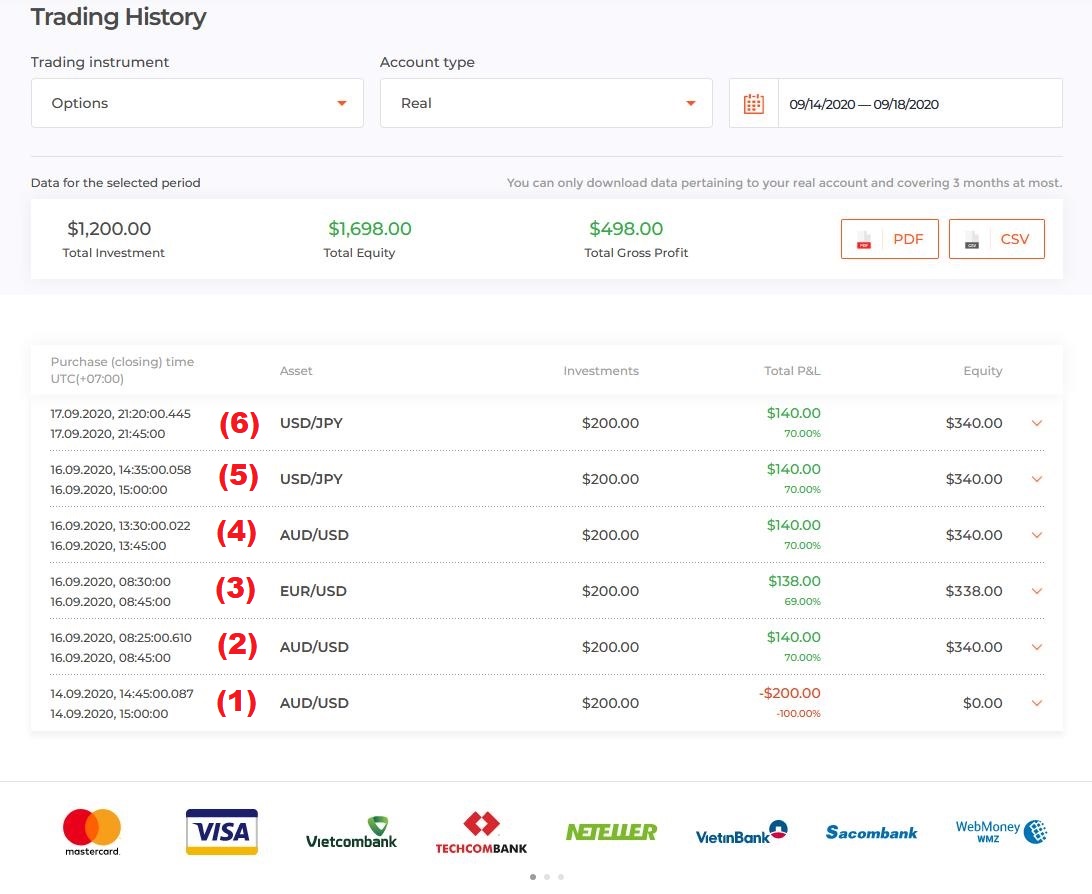
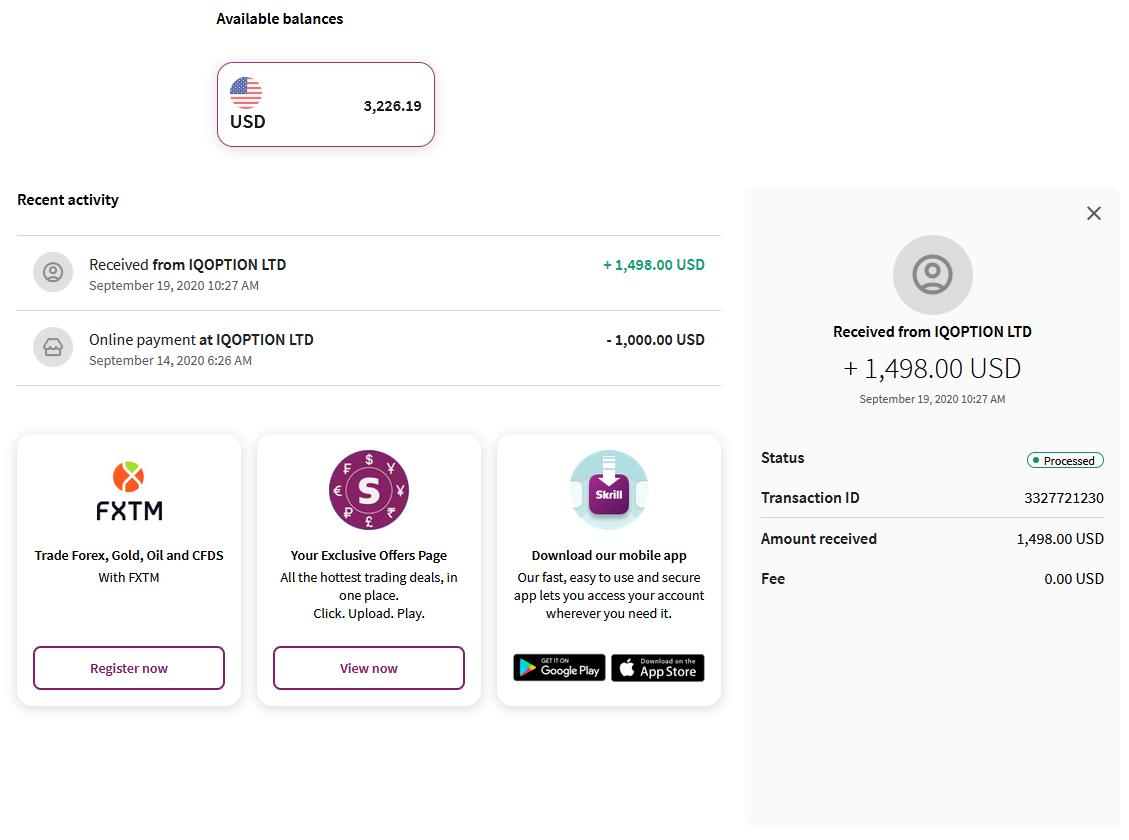
This article will introduce to you the Double Top and Double Bottom patterns that Forex traders often use to apply to trade options in IQ Option. This special chart patterns trading strategy helps me bring over $498 in the previous week.
Ideas are tools that help you reach success faster. However, to do that, your mindset must be sharp to combine the available things. In trading, Forex and Options are two different categories. However, we can combine the quintessence that they have to create a winning formula.
“Write down ideas on paper and study them. Don’t waste them.”
Đăng Ký IQ Option Nhận Miễn Phí 10.000$ Risk warning: Your capital might be at risk.
Review on Options trading orders with the Double Top and Double Bottom patterns in IQ Option
Conditions: A 5-minute Japanese candlestick chart. The expiration time of 15 minutes to 30 minutes.
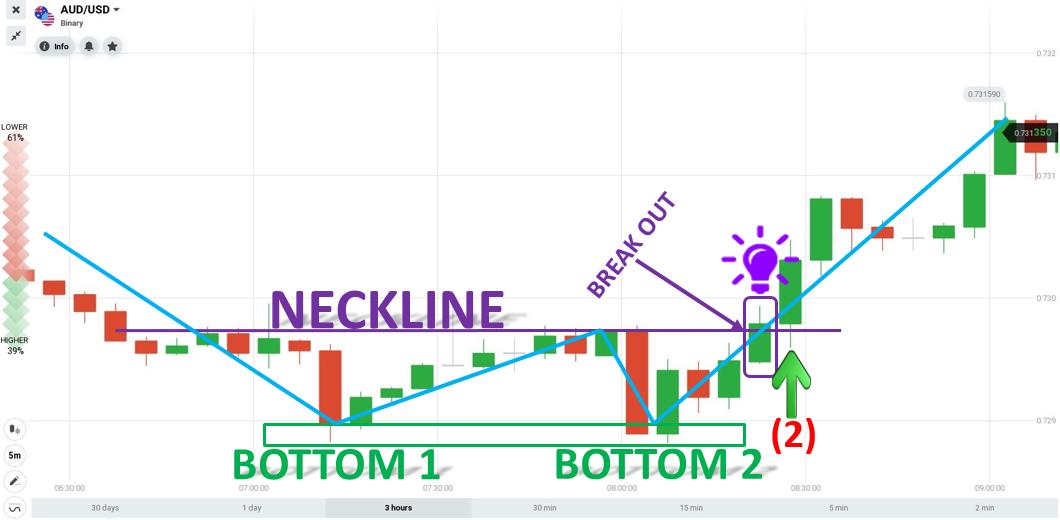
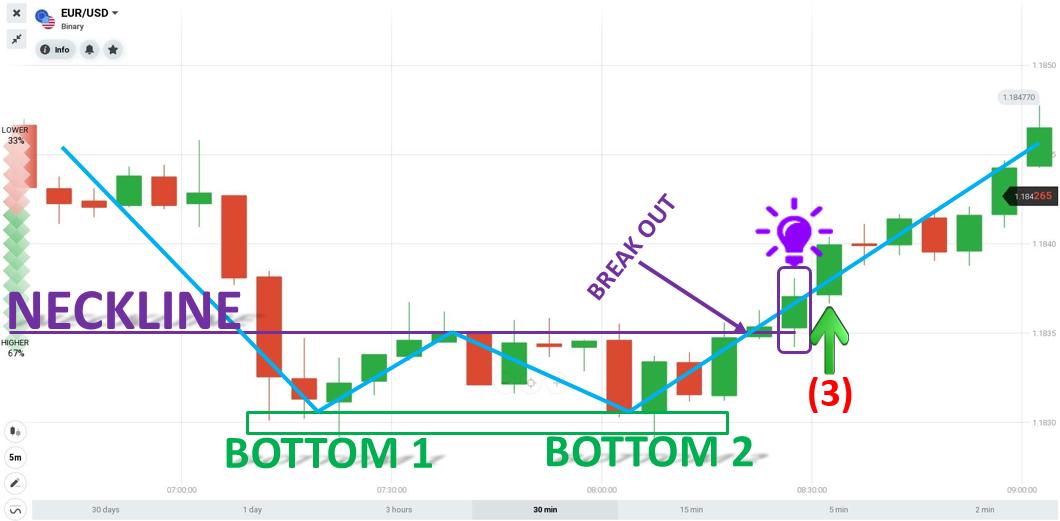
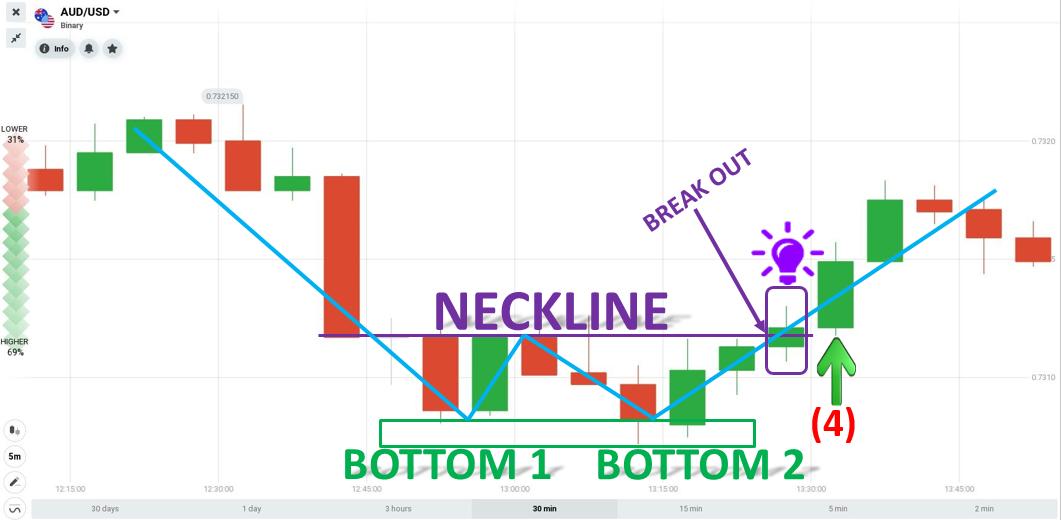
Open HIGHER orders when: The Double Bottom pattern appears and the price breaks out of the neckline.
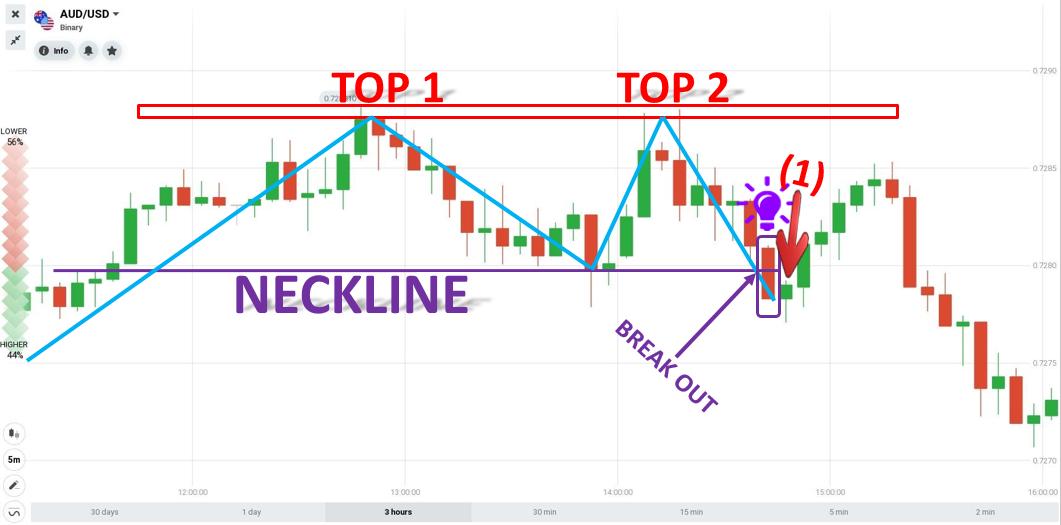
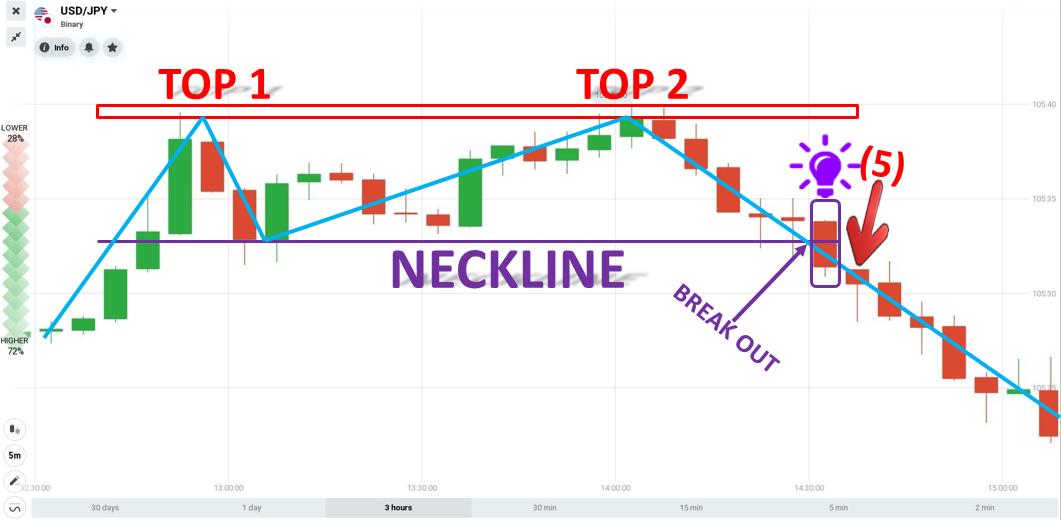
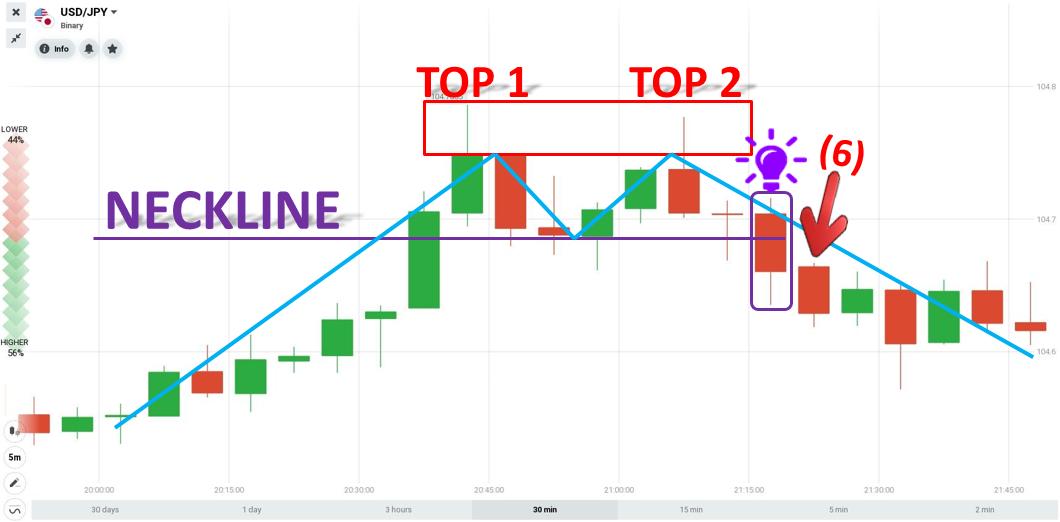
Open LOWER orders when: The Double Top pattern appears and the price breaks out of the neckline.
Only trade with the following 3 assets pairs: EUR/USD, AUD/USD, USD/JPY.
Classic capital management method (balanced investment)
1st order: A Double Top pattern appeared. Opened a LOWER order when the price broke out of the neckline.
2nd order: A Double Bottom pattern appeared. Opened a HIGHER order when the price broke out of the neckline.
3rd order: A Double Bottom pattern appeared. The neckline breakout of the price was not definitive. Waited for another bullish candlestick to safely open a HIGHER order.
4th order: A Double Bottom pattern appeared. Opened a HIGHER order when the price broke out of the neckline.
5th order: A Double Top pattern appeared. Opened a LOWER order when the price broke out of the neckline.
6th order: A Double Top pattern appeared. Opened a LOWER order when the price broke out of the neckline.
What are chart patterns?
Technical analysts find that the market tends to repeat history. This is shown in terms of the asset’s prices at a specified time period.
By observing the price trend, price level, trading volume, etc. of an asset, analysts build price charts, so-called chart patterns, to predict future asset price trends.
Types of chart patterns in technical analysis
Typical chart patterns are divided into three categories: reversal chart pattern, continuation chart pattern, and bilateral chart pattern (trend unknown).
Reversal chart patterns signal changes in asset price trends. Continuation chart patterns signal a continuation of the current up or down trend. In a bilateral chart pattern, the price can follow both an up or down scenario.
Some reversal chart patterns include:
√ Double Top
√ Double Bottom
√ Head and Shoulders
Some continuation chart patterns include:
√ Flag
√ Wedge
√ Triangle
√ Cup and Handle
Some bilateral chart patterns include:
√ Ascending Triangle.
√ Descending Triangle.
√ Symmetrical Triangle.
The Double Top and Double Bottom patterns are what I like to use for trading in IQ Option.
Trendline in technical analysis
Before studying chart patterns, you need to have a basic knowledge of trendlines. In order to draw support and resistance levels on chart patterns, trendlines are required.
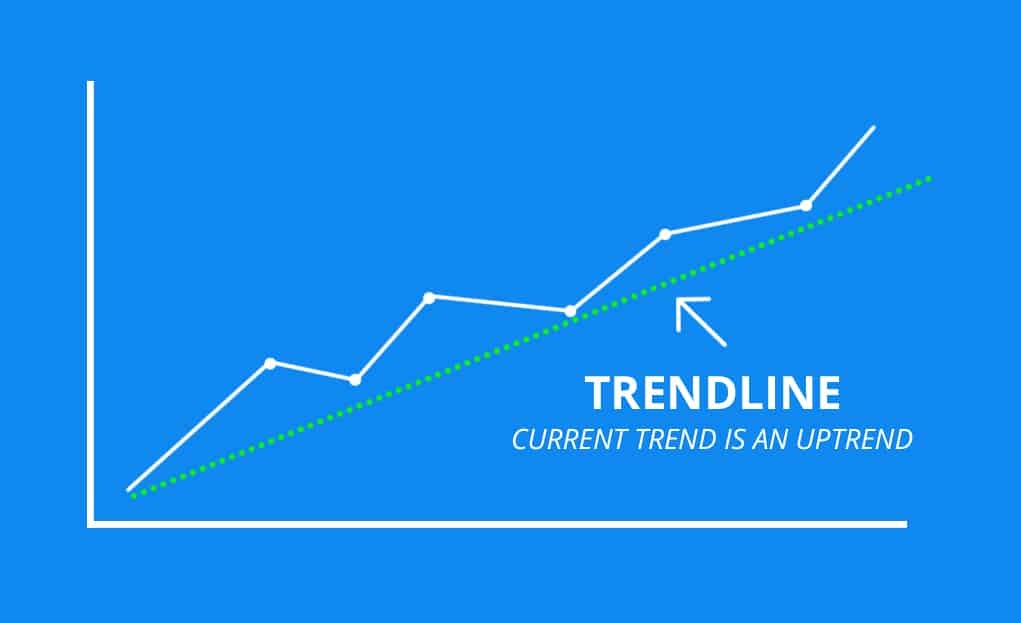
A trendline is a line on the price chart. It is used to connect peaks or troughs to create an uptrend or a downtrend over a period of time. To draw trendlines, we usually use closing prices instead of intraday peaks and troughs.
Trendlines help traders identify assets that are trending up, down, or going sideways. From there, they can determine whether to trade or not. If they do, they will also know how to place the position.
Why do we need to use chart patterns in IQ Option?
There are many technical analysis strategies currently being used in the financial markets. Each strategy has its own strengths and weaknesses. But to meet the strict conditions of experienced investors, only chart patterns can do it.
Trading on the chart pattern is one of the very simple, easy to learn, and extremely effective strategies. Especially, there are simple reversal patterns such as Double Top, Double Bottom, Triple Top, etc. which are easily recognizable.
Pros

You just need to memorize the chart patterns, the conditions required to place an order, and then wait for them to appear. And if you adeptly trade on price action, you will learn how to best find your entry and exit points to maximize your profits.
From my experience, I have clearly seen that trading on the chart pattern allows you to buy and sell at a much better price than using indicators to trade. Since they are inherently mathematical formulas based on the past, they always have a certain delay. Especially for the Crypto market, when everything is going so fast, indicator traders often miss the opportunity to buy and sell at good prices.
This is different from when you use the chart pattern. This strategy focuses only on real-time prices and you can make decisions based on this information. So making your buy/sell decision will be easier and at a better price.
Cons

The biggest difficulty with the chart pattern trading strategy lies in the fact that you need to follow the chart carefully every time you trade and make your own decisions. For most professional traders, this should not be an issue. However, new traders will find it difficult to identify the pattern.
One of the other weaknesses of this strategy is that it is most suitable for markets and assets with high liquidation such as Forex, US stocks. Therefore, when applying it to the Crypto market, you should only use it with high trading volume asset pairs such as Bitcoin, Ethereum, XRP, etc. For low trading volume Crypto pairs, this chart pattern will almost have no effect.
Of course, this strategy doesn’t give you a 100% win rate either. Like every other trading strategy, there will come a time when you have to cut losses. You cannot avoid a 100% risk in trading. Losses always come along the way with traders. However, the important issue will be that your win rate is much higher than the loss rate. And with practice over time, trading on chart patterns will give you just that.
One last word
Through the above article, you may partly imagine how to trade with the Double Top and Double Bottom patterns. This is the easiest and most profitable strategy for users to trade. If you still have difficulty identifying the Double Top and Double Bottom patterns, you can project different time frames to draw the pattern on your own. Once you master it, you can enter real trades to make money in IQ Option.
Đăng Ký IQ Option Nhận Miễn Phí 10.000$ Risk warning: Your capital might be at risk.
English Indonesia Português ไทย العربية हिन्दी 简体中文 Nederlands Français Deutsch हिन्दी Italiano 한국어 Melayu Norsk bokmål Русский Español Svenska Tamil Türkçe Zulu


