

![]()
![]()
![]()
![]()
![]()
![]()
![]()
![]()
![]()
![]()
![]()
![]()
![]()
![]()
![]()
![]()
![]()
![]()
![]()
![]()
![]()

Stochastic Oscillator is a very effective indicator to analyze and confirm price trends. At the same time, in IQ Option, Stochastic Oscillator also gives safe signals to open options.
In this article, I will guide in detail how to use Stochastic Oscillator indicator. Moreover, there are specific IQ Option trading techniques around it.
Register IQ Option and Get Free $10,000 Risk warning: Your capital might be at risk.
What is Stochastic Oscillator indicator?
Stochastic Oscillator (as known as Stochastic) is a momentum indicator. It compares closing prices with a specific price range in a certain time period.

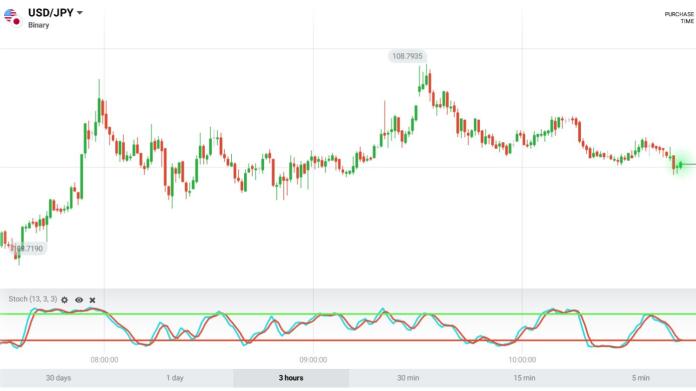
Stochastic Oscillator indicator shows the momentum of prices. In technical analysis, momentum always goes ahead of prices. Hence, this is the basis for us to use Stochastic to predict the direction of prices.
Structure of Stochastic Oscillator indicator in IQ Option includes 4 lines
2 moving lines including:
• The main line is called the %K line (green).
• The remaining line is the %D line (red). This is the moving average of %K.

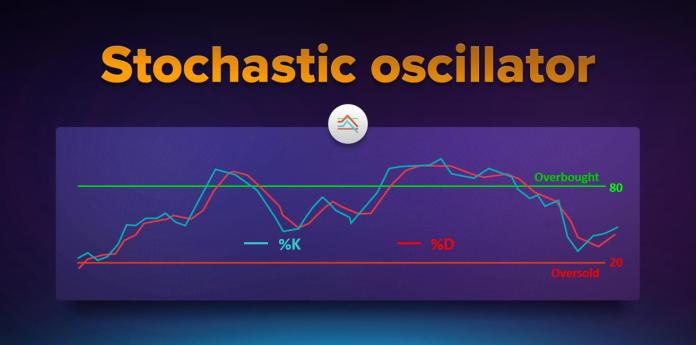
2 horizontal fixed lines are 80 and 20.
• When Stochastic is above 80, the market is entering the overbought zone.
• When Stochastic is below 20, the market is entering the oversold zone.
Stochastic Oscillator indicator – How does it work?
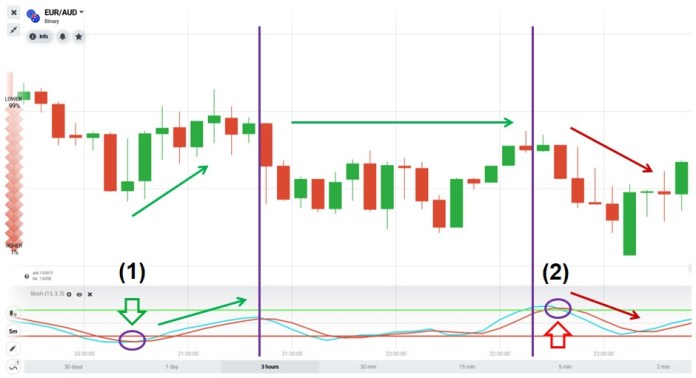
(i) Confirm the price trend from the crossover of Stochastic Oscillator.
Stochastic Oscillator indicator always ranges from 0 to 100. 80 is overbought and 20 is oversold.
• (1) When %K crosses %D from below 20 (oversold zone) and goes up. => The price tends to increase.
• (2) On the contrary, when %K crosses %D from above 80 (overbought zone) and goes down. => The price tends to decrease.

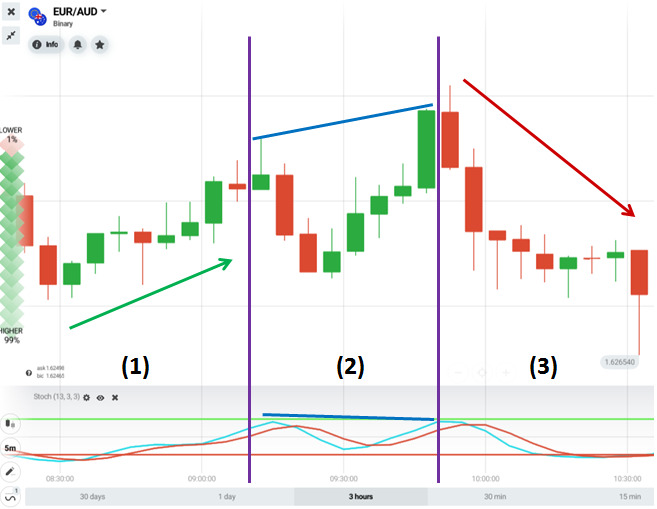
(ii) Stochastic Oscillator divergence
Stochastic Oscillator divergence is a phenomenon when the indicator goes against the price. It means that the price increases but Stoch indicator decreases. Or vice versa, the price decreases but Stoch indicator increases.
For example,
• (1) Price is in an uptrend.
• (2) Stochastic Oscillator divergence appears. Price increases but Stochastic Oscillator indicator decreases.
• (3) Market reverses from rising to falling.

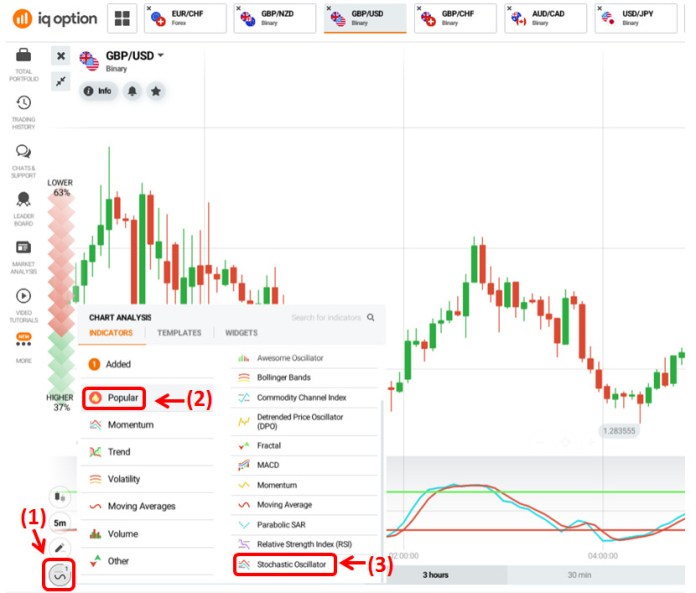
How to set up Stochastic Oscillator indicator in IQ Option
To create Stoch indicator. (1) Click on the indicator box => (2) Popular tab => (3) Select Stochastic Oscillator.

How to trade options with Stochastic indicator in IQ Option
Stochastic Oscillator is a momentum indicator. So it gives trading signals that precede the market price. Thus, the best way to trade in IQ Option with this indicator is to open long-time options.
Technique 1: Combine Stochastic Oscillator with Support and resistance
If you do not know how to identify or draw support and resistance levels, you can see the following article. Support and resistance – The best technical indicator when trading in IQ Option.
Requirements: 5-minute Japanese candlestick chart + Stochastic Oscillator indicator. Besides, the expiration time is 15 minutes or more.
Trading technique:
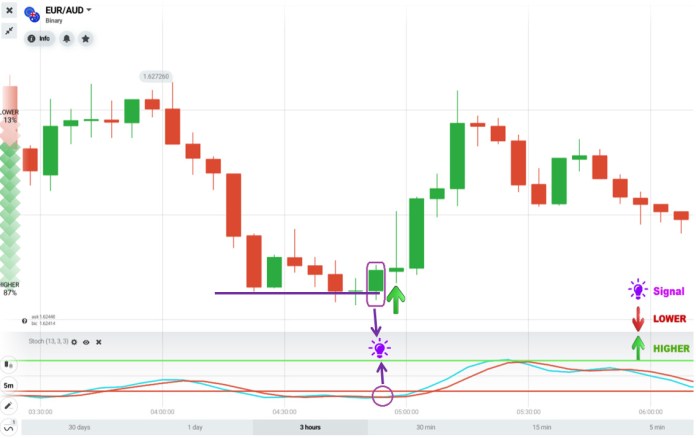
HIGHER = The price enters the support zone + Stochastic Oscillator is in the oversold zone.

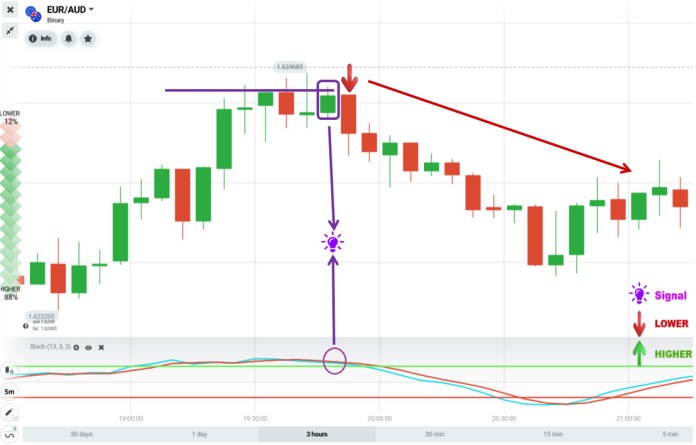
LOWER = The price enters the resistance zone + Stochastic Oscillator is in the overbought zone.

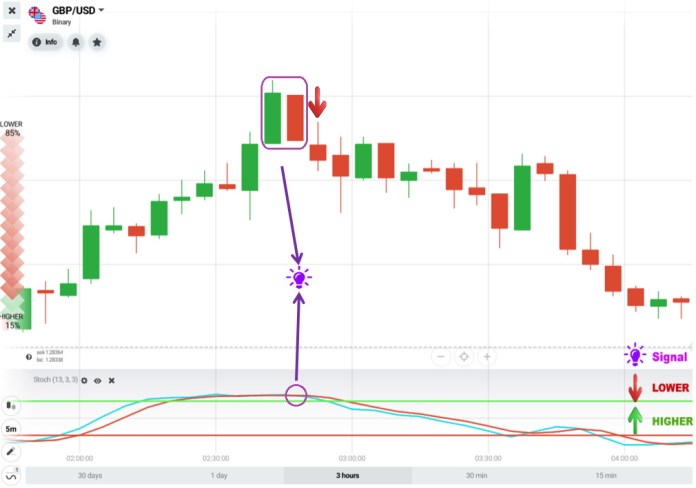
Technique 2: Combine Stochastic Oscillator indicator with reversal candlestick patterns
Requirements: Japanese 5-minute candlestick chart + Stochastic Oscillator indicator. The expiration time is also 15 minutes or higher.
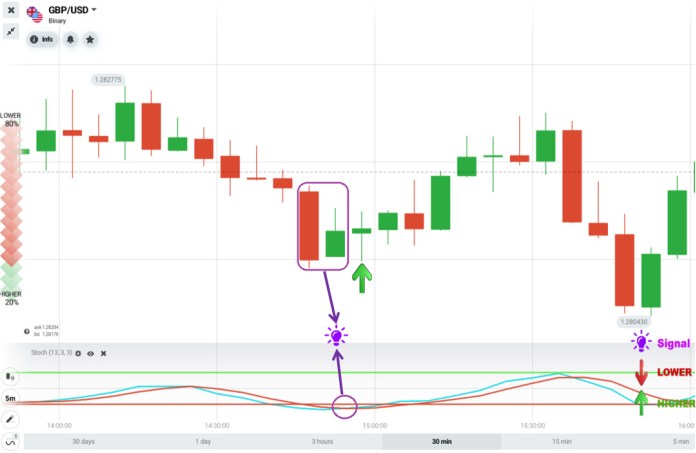
Note: Trading signals are trend reversal candlestick patterns that appear when Stochastic Oscillator indicator is in the overbought or oversold zone.
Trading technique:
HIGHER = Bullish Harami candlestick pattern + Stochastic Oscillator is below 20 (Oversold).

LOWER = Bearish Harami candlestick pattern + Stochastic Oscillator is above 80 (Overbought).

In addition, there are still many ways in combination with Stochastic Oscillator indicator to trade in IQ Option. You can experience it with your IQ Option Demo account using the registration box below. Love!
Register IQ Option and Get Free $10,000 Risk warning: Your capital might be at risk.
![]()
![]()
![]()
![]()
![]()
![]()
![]()
![]()
![]()
![]()
![]()
![]()
![]()
![]()
![]()
![]()
![]()
![]()
![]()
![]()
![]()