

![]()
![]()
![]()
![]()
![]()
![]()
![]()
![]()
![]()
![]()
![]()
![]()
![]()
![]()
![]()
![]()
![]()
![]()
![]()
![]()
![]()

Morning Star is a candlestick pattern that signs a high probability of a reversal of the market trend. Traders use it as a signification for opening options in IQ Option. In this article, I will guide you to identify and trade effectively with Morning Star candlestick pattern in IQ Option.
Register IQ Option and Get Free $10,000 Risk warning: Your capital might be at risk.
What is Morning Star candlestick?
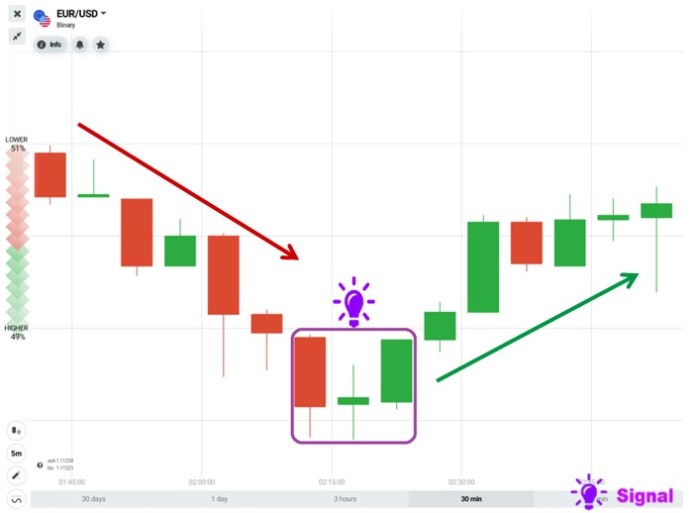
Morning Star candlestick pattern is a pattern of 3 reversal candlesticks which appear at the end of a downward trend. It is seen as a sign of a reversal from a downtrend to an uptrend in the market.

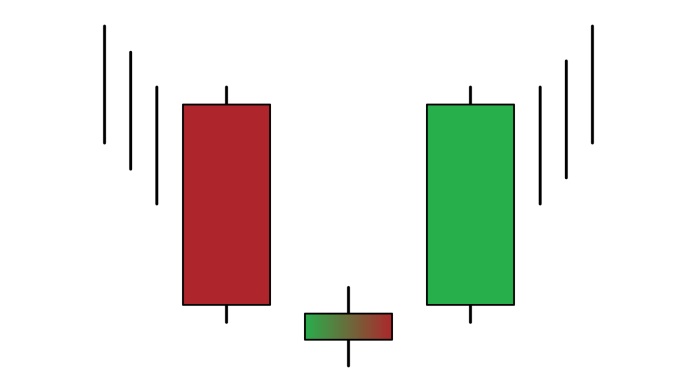
Morning Star pattern consists of 3 candlesticks including:
1st candlestick: Bearish candlestick (red).
2nd candlestick: Doji or Spinning candlestick.
3rd candlestick: Bullish candlestick (green). Its body length has to be at least 50% of the length of the 1st candlestick’s body.
How to trade in IQ Option with Morning Star pattern
This is a reversal pattern. Therefore, you can use it in combination with other reversal indicators to create a suitable trading strategy in IQ Option.
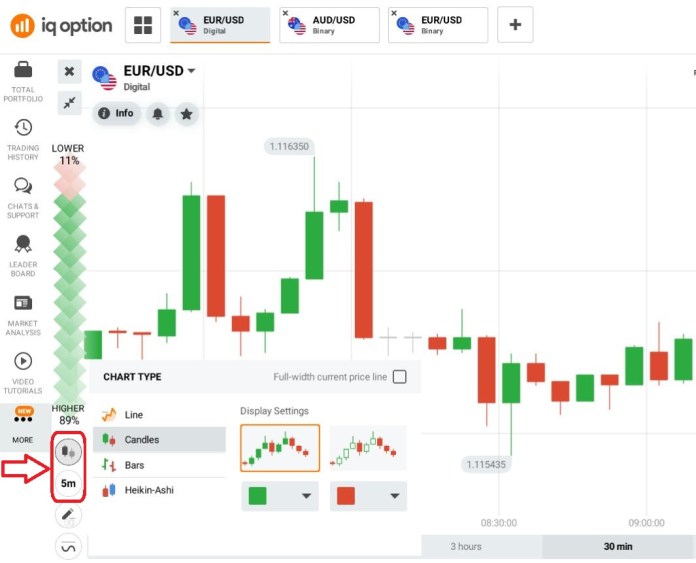
You have to set up a 5-minute candlestick chart to start trading with this pattern. In addition, the expiration time has to be from 15 minutes.

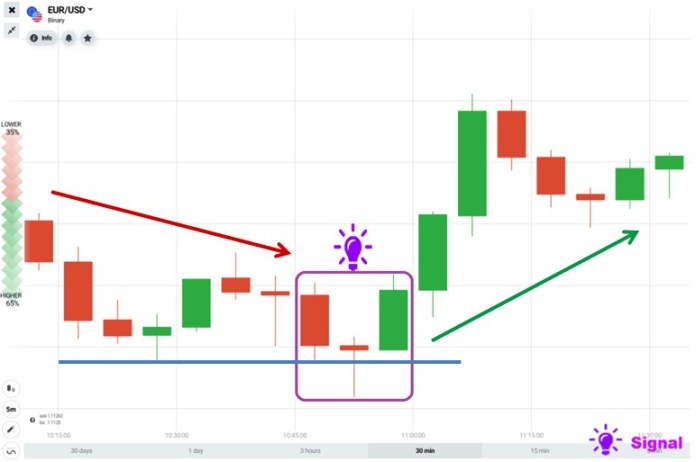
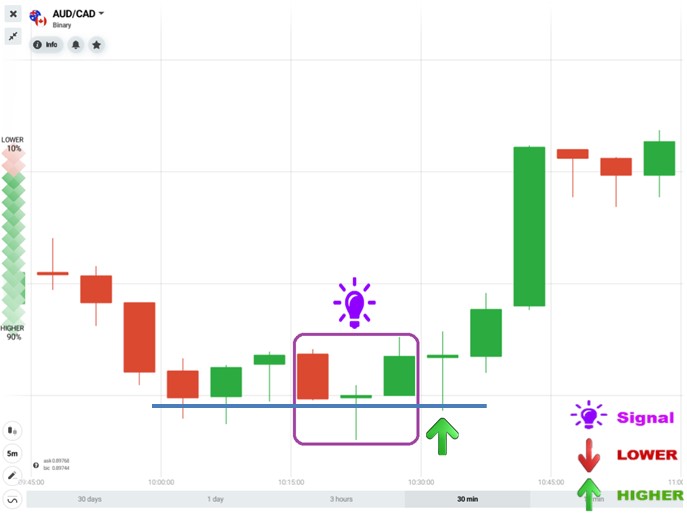
Morning Star pattern + Support zone = HIGHER.
Explanation: When the price falls into the support zone, it will be likely to rises again. At the same time, the appearance of Morning Star pattern ensures the reversal of the price => Buy HIGHER options.
For example, EUR/USD currency pair

Pair of currency AUD/CAD

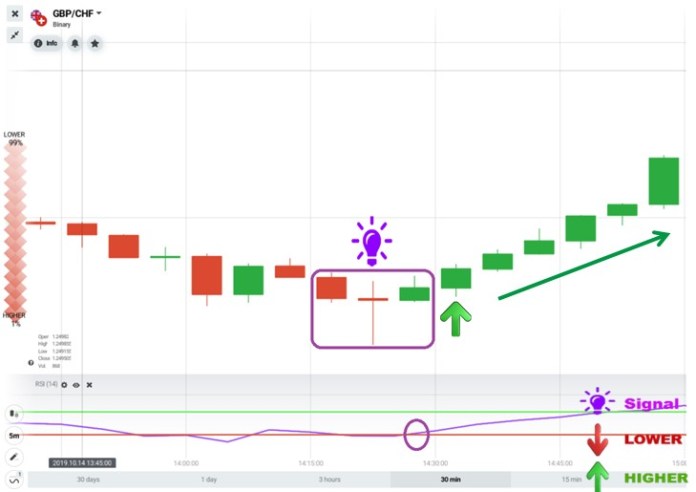
Morning Star pattern + RSI indicator (Oversold) = HIGHER
Explanation: When the price falls and RSI is in the oversold zone, the probability of reversal is very high. If you use Morning Star pattern to confirm the reversal, you can open a HIGHER option after that.

Some notes when using Morning Star pattern in IQ Option
The time period for the Japanese candlestick chart should be 5 minutes or higher. The longer the time of the candlestick is, the more reliable the chart becomes.
You should trade when all 3 candlesticks of the pattern appear. Open options flexibly with the expiration time longer than the candle time period.
Do not care about the pair of currency. You just need to trade when there are enough signs for buying an option.
You can experience IQ Option with a Demo account by clicking the below box. Wish you success!
Register IQ Option and Get Free $10,000 Risk warning: Your capital might be at risk.
![]()
![]()
![]()
![]()
![]()
![]()
![]()
![]()
![]()
![]()
![]()
![]()
![]()
![]()
![]()
![]()
![]()
![]()
![]()
![]()
![]()