
![]()
![]()
![]()
![]()
![]()
![]()
![]()
![]()
![]()
![]()
![]()
![]()
![]()
![]()
![]()
![]()
![]()
![]()
![]()
![]()
![]()

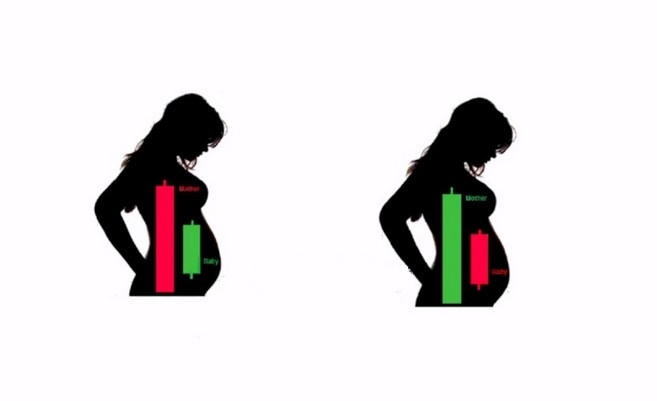
Harami candlestick pattern is widely known by professional traders when it appears in the price chart. When it appears, the market trend is very likely to reverse. So what is Harami? What are its features? How to recognize and trade with it in IQ Option?
Register IQ Option and Get Free $10,000 Risk warning: Your capital might be at risk.
What is Harami candlestick pattern?
Harami is a reversal pattern that often appears at the end of an upward or downward trend, signifying the end of that trend. It is seen as a reliable sign for buying options in IQ Option.

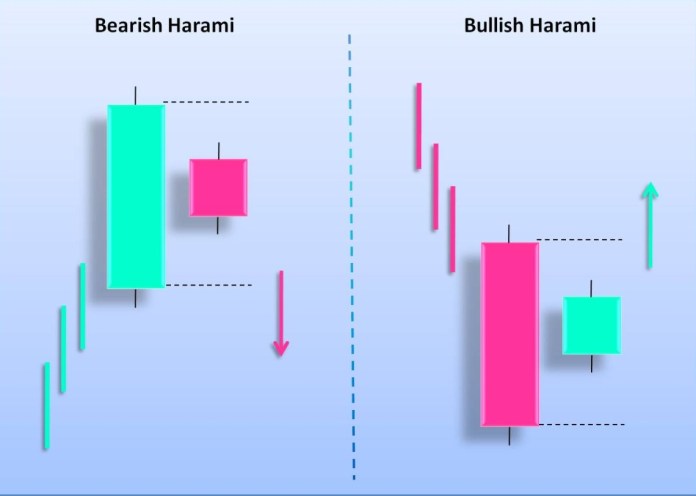
Harami pattern which appears at the end of an upward trend is Bearish Harami. If the pattern appears at the end of a downward trend, it is called Bullish Harami.
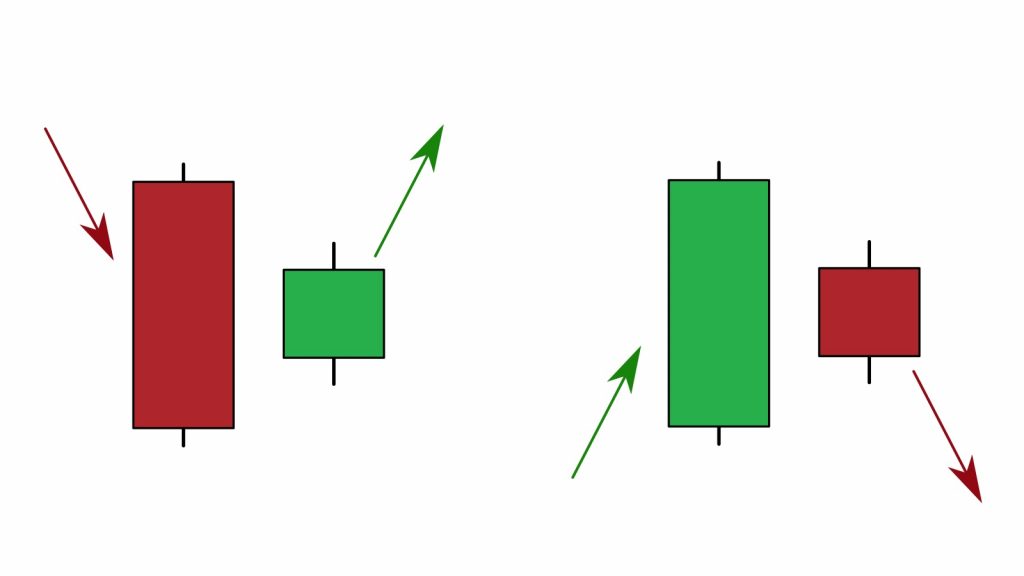
The pattern consists of 2 candlesticks including:
• 1st candlestick: bullish or bearish candle.
• 2nd candlestick: a small candle in which the body is completely contained within the vertical range of the 1st candle’s body and has the opposite color to the 1st candle’s color.

Some examples of Harami pattern
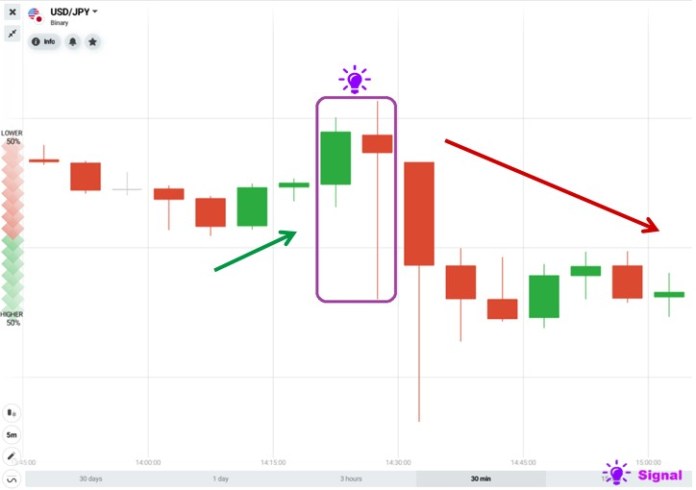
Harami candlestick pattern appears at the end of the downward trend => The market trend changes from downward to upward.

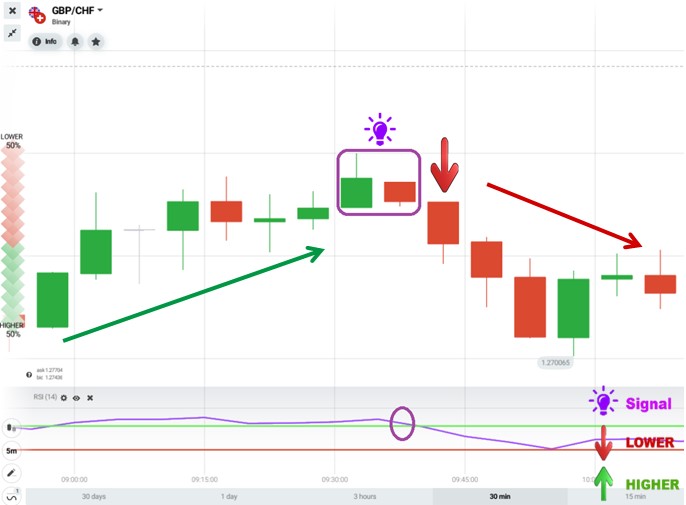
Harami pattern appears at the end of an upward trend => The market trend changes from upward to downward.

How to trade in IQ Option with Harami pattern
This pattern signs a very high probability of reversal. You should use this pattern in combination with other reversal indicators so that you can find perfect entry points to buy options.
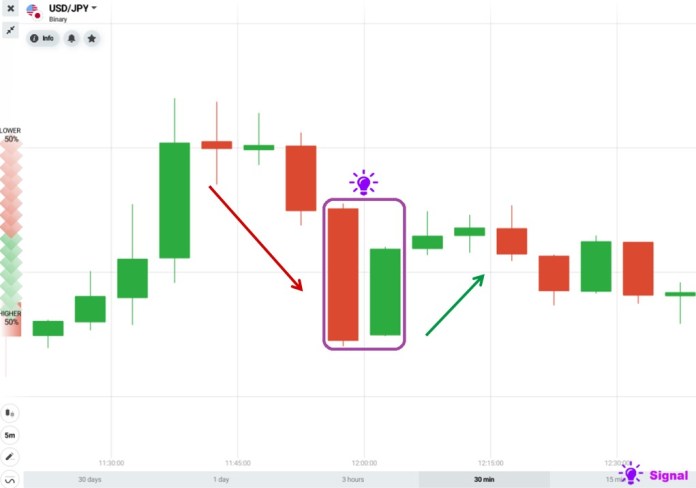
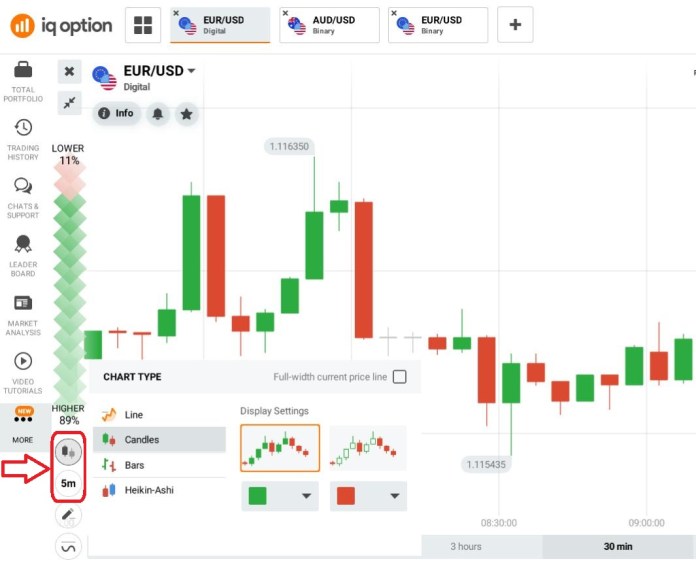
Use a 5-minute Japanese candlestick chart in IQ Option. On the other hand, the most suitable expiration time should be from 15 minutes or higher.

In combination with Support and resistance
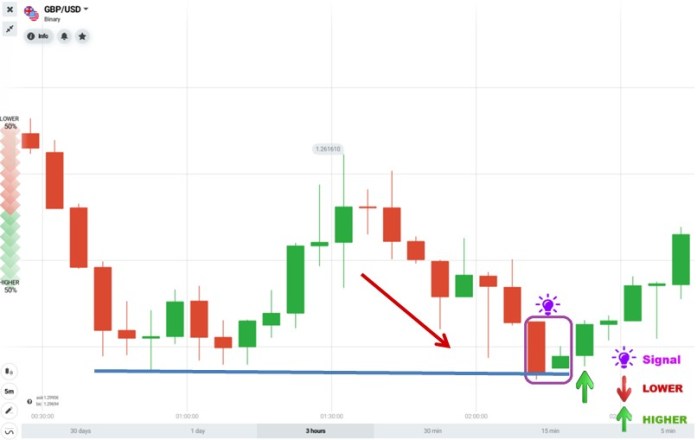
Strategy to buy options:
Buy HIGHER = Bullish Harami candlestick pattern + Resistance zone.
Explanation: The price tends to fall when it reaches support. At that time, the appearance of Bullish Harami is the trading signal => Buy HIGHER.

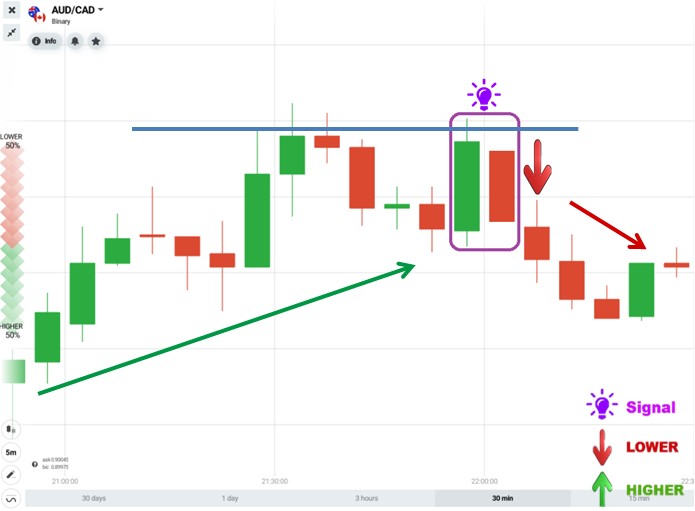
Buy LOWER = Bearish Harami + Resistance zone.

In combination with RSI indicator
How to buy options:
Buy HIGHER = Bullish Harami + RSI under 30 (Oversold line)

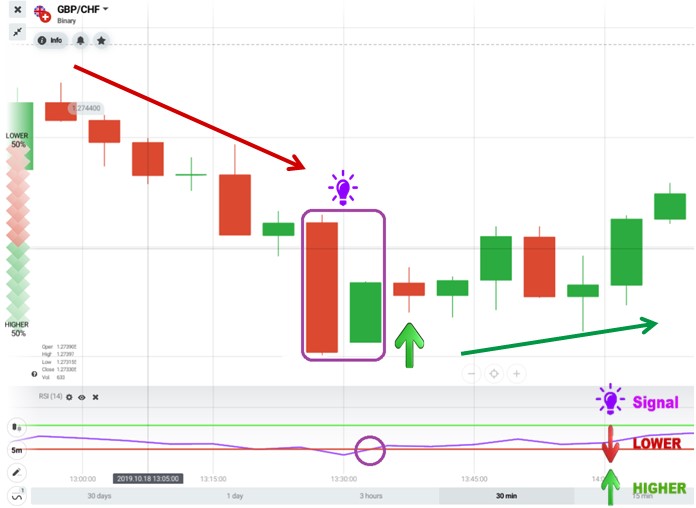
Buy LOWER = Bearish Harami + RSI above 70 (Overbought line)

Some notes about Harami candlestick pattern
The candle time period of Japanese candlestick chart should be from 5 minutes or more. The longer the time frame of the candlestick chart is, the more precise the chart becomes.
When 2 candlesticks of Harami candlestick pattern completely appear, it’s time to buy an option.
You can experience trading in IQ Option with a Demo account by clicking the below button. Wish you success!
Register IQ Option and Get Free $10,000 Risk warning: Your capital might be at risk.
![]()
![]()
![]()
![]()
![]()
![]()
![]()
![]()
![]()
![]()
![]()
![]()
![]()
![]()
![]()
![]()
![]()
![]()
![]()
![]()
![]()