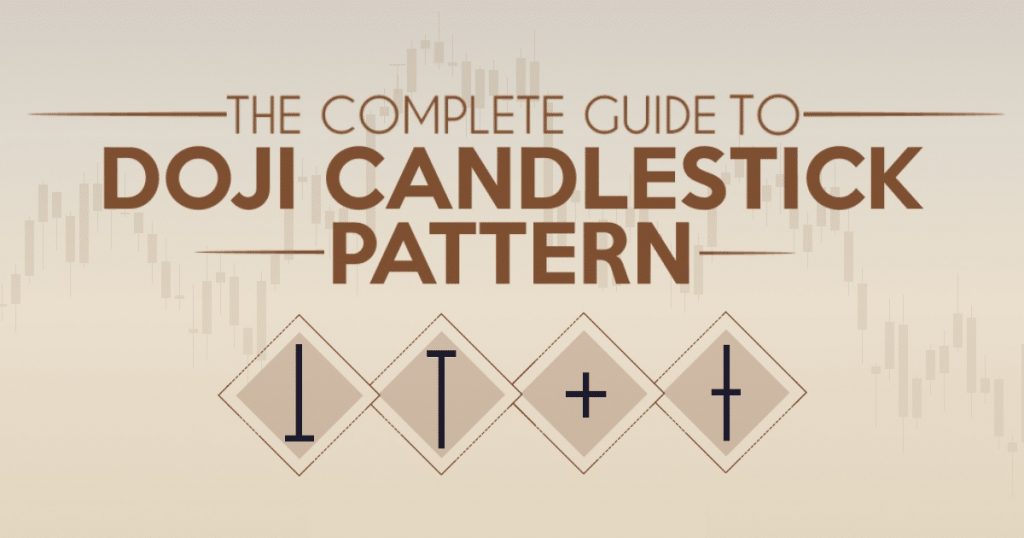
Doji is a candlestick pattern that is very easy to identify. When it appears in the chart, you should observe the market carefully. When you combine it with other candlesticks and indicators, Doji will give you reliable entry points in IQ Option.
Register IQ Option and Get Free $10,000 Risk warning: Your capital might be at risk.
What is Doji candlestick? How does it work in IQ Option
Doji (means “Unchanged” in Japanese) is a special candlestick pattern which has similar or the same opening and closing prices.
When a Doji candlestick appears, both sellers and buyers do not take advantage of controlling the price. The appearance of Doji signifies the stagnation of the market.
Doji candlestick features
There are 4 types of Doji candlestick that you often come across: Neutral Doji, Long-Legged Doji, Dragonfly Doji, Gravestone Doji.
Neutral Doji looks like a plus mark “+”. It shows that when the candlestick is formed. The price does not increase or decrease remarkably.
Long-Legged Doji is contrary to Neutral Doji. When Long-Legged Doji is formed, the price fluctuates significantly. However, the opening price is equal to the closing price.
Dragonfly Doji looks like the letter “T”. It has a long lower shadow. Opening price and closing price are equal to the highest price during the time the candlestick is formed.
Gravestone Doji is contrary to Dragonfly Doji. Opening price and closing price are equal to the lowest price during the time the candlestick is formed.
Trade signals in IQ Option with Doji candlestick pattern
4 different types of Doji candlestick pattern show 4 different trade signals. The ways we use them in combination with indicators are also different.
Neutral Doji
It is a candlestick pattern that has no effect when standing alone. However, when it is formed at support/resistance zone, you should pay close attention to it. The reason is that it is the moment when the market is on the horn of a dilemma. The price will reverse or break out of support/resistance zone.
For example, Signal Doji candlestick appears in the support zone. Focus on the appearance of the next candlestick after that. If the price rises (green candlestick) to confirm the price reversal when the price reaches the support zone. Open a HIGHER option after that.
On the other hand, if the market price falls steeply and breaks out of the support zone and one red candlestick is formed, you can open a LOWER option after that.
You should open an option which is 3 times longer than the candle time period. For example, if you observe the 5-minute Japanese candlestick chart, you should change the expiration time to 15 minutes.
Long Legged Doji
Unlike Neutral Doji, Long-legged Doji candlestick shows a “war” between buyers and sellers. The price fluctuates dramatically but closing price is the same as opening price. Long-legged Doji often appears at the bottom or the top of the market. This is a sign for you to open options in IQ Option.
For example, Long-legged Doji appears at the top of the trend. It is the signal of a high possibility that the market will reverse and go to a downward trend. Open a LOWER option right after that.
Dragonfly Doji and Gravestone Doji
These are the other 2 versions of Hammer candlestick and Shooting Star candlestick. These candlestick patterns rarely appear in IQ Option trading.
The probability of price trend reversal is high when the 2 patterns appear. For example, when the price falls, Dragonfly Doji candlestick appears => the price reverses to an upward trend => Buy a HIGHER option.
On the contrary, the price rises and Gravestone Doji candlestick appears => the price reverses to a downward trend => buy a LOWER option. The longer its shadow is, the more reliable this candlestick has.
This is the introduction of basic Doji candlestick patterns. It’s also the signal for opening options in IQ Option. If you want to discuss this topic with us, please leave a comment.
Good luck!
Register IQ Option and Get Free $10,000 Risk warning: Your capital might be at risk.
