
![]()
![]()
![]()
![]()
![]()
![]()
![]()
![]()
![]()
![]()
![]()
![]()
![]()
![]()
![]()
![]()
![]()
![]()
![]()
![]()
![]()

Bollinger Bands are one of the most useful technical indicators when trading options. Many traders use it as a guideline to buy options in IQ Option. So what is Bollinger Bands indicator? How can we use it in IQ Option trading?
Especially, which indicators we should use with it to realize safe entry points? After reading this article, you will know everything.

Register IQ Option and Get Free $10,000 Risk warning: Your capital might be at risk.
What is Bollinger Bands indicator?
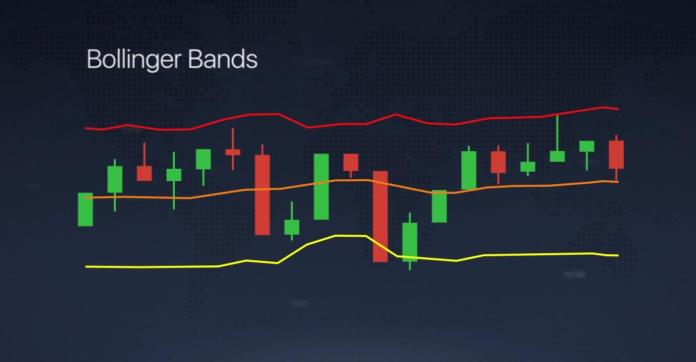
Bollinger Bands are a technical indicator formed by combining the moving average SMA and its Standard Deviation. As a rule, the price will always move within the range of Bolligner Bands indicator.

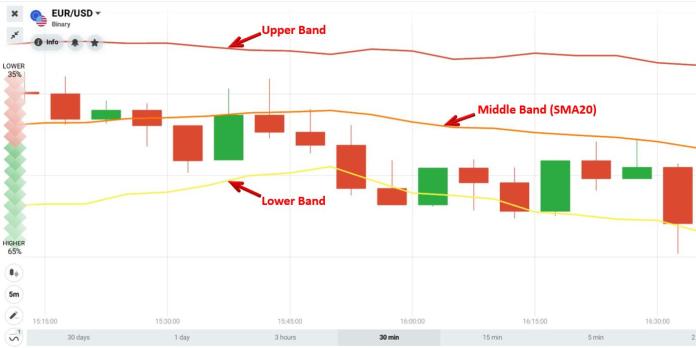
Bollinger Bands are made up from 3 lines including:
• Upper Band
• Middle Band – The moving average SMA20.
• Lower Band
Bollinger Bands indicator – How does it work?
The main trend of the market is the most important signal for you to build your IQ Option trading strategy. If you can catch the trend, your winning probability is almost certain.
Bollinger Bands and the uptrend
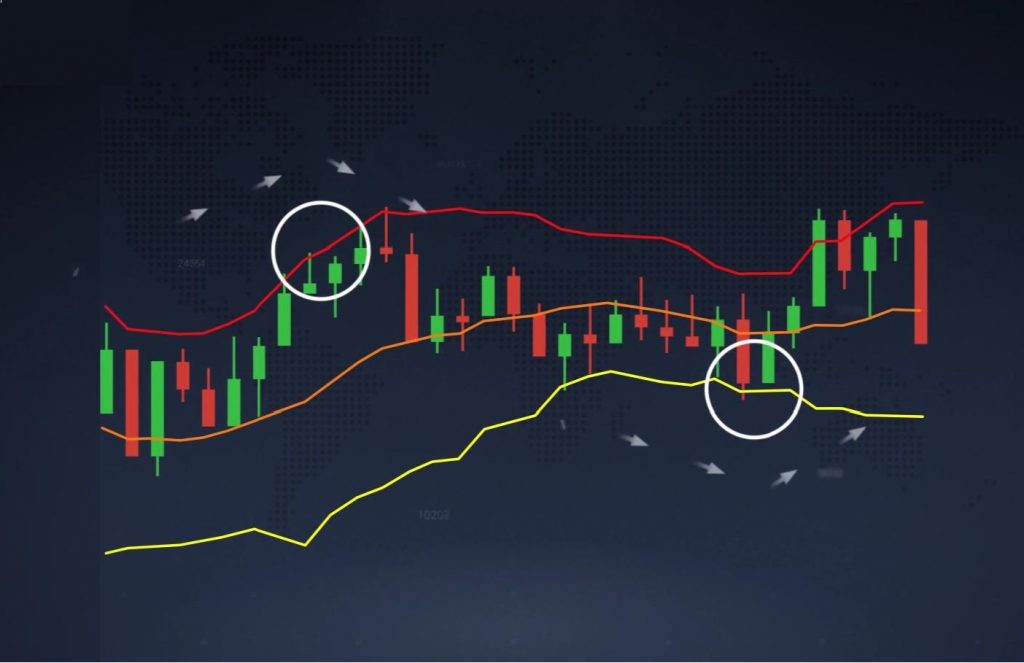
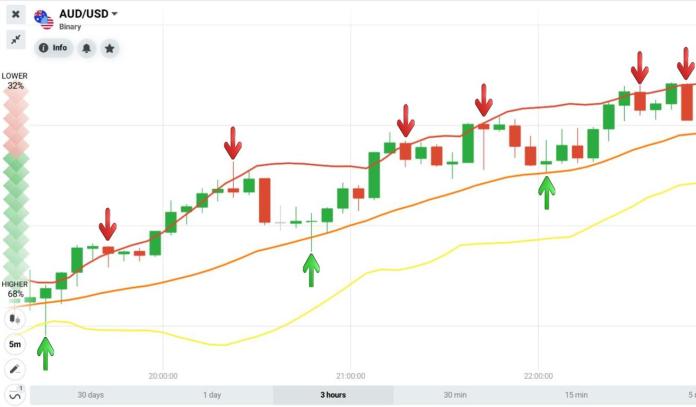
In an uptrend, the price will move above the SMA20. At this time, when the price tends to touch the middle line (SMA20), it will go up. Moreover, when the price breaks out of the upper band, it tends to fall back into the band.

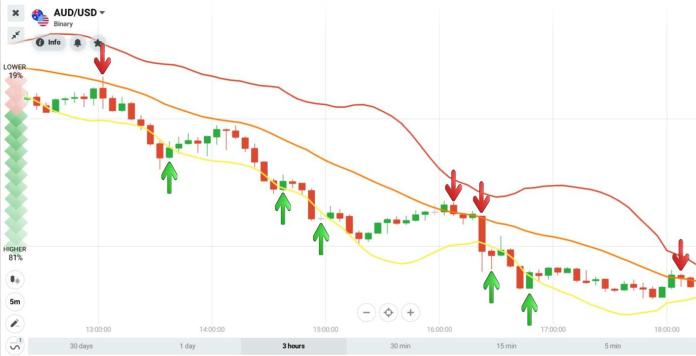
Bollinger Bands and the downtrend
Conversely, in a downtrend, the price will move below the SMA20. When the price tends to hit the middle line (SMA20), it will fall back. Furthermore, when the price breaks through the lower band, it tends to increase and return to the band.

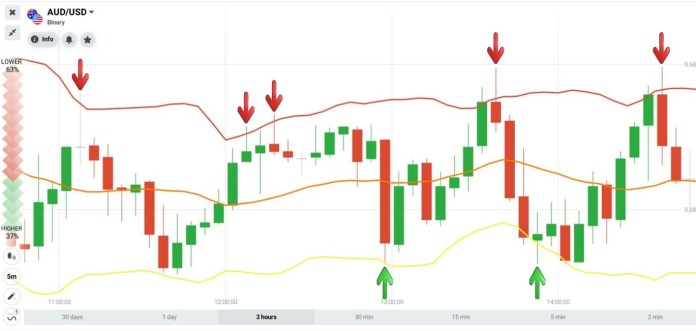
Bollinger Bands and the sideways trend
When the market is flat, the price will move within the upper and lower bands. In general, when the price tends to touch the upper band, it will fall back. On the other hand, when the price hits the lower band, it will bounce back.

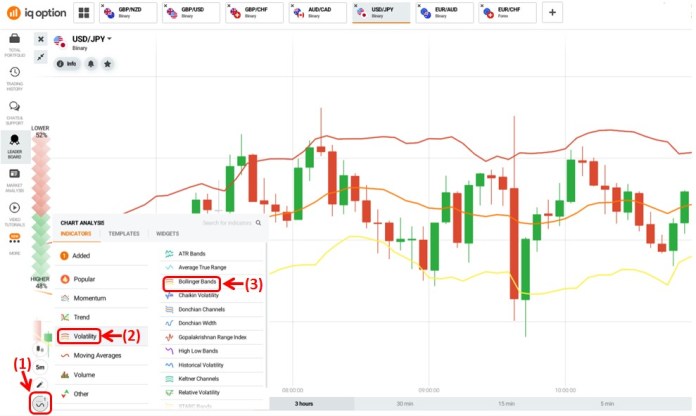
How to set up Bollinger Bands in IQ Option
To create Bollinger Bands indicator: (1) Click the indicator box => (2) Volatility tab => (3) Select Bollinger Bands.

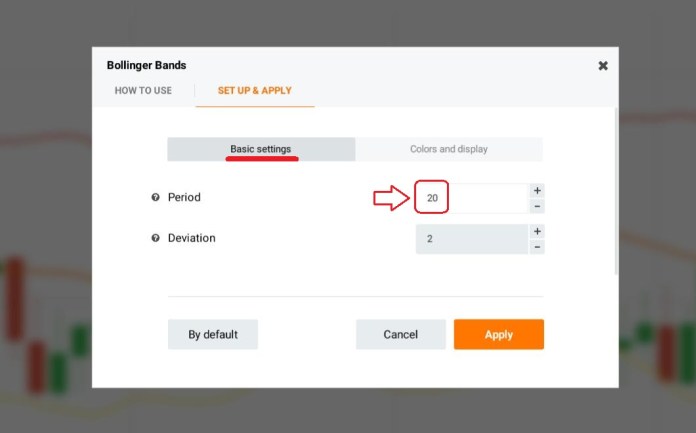
In IQ Option, Bollinger Bands’ period is 14 and its deviation is 2. These are not common settings of Bollinger Bands indicator. Thus, you can set up this parameter to Period 20 and Deviation 2.

IQ Option trading strategy with Bollinger Bands indicator
There are many ways for you to build an appropriate strategy for trading options in IQ Option. In this article, I will introduce some long-time trading methods.
Overall, long-time trading means that if you are observing a Japanese 5-minute candlestick chart, then your expiration time will be 15 minutes or more.
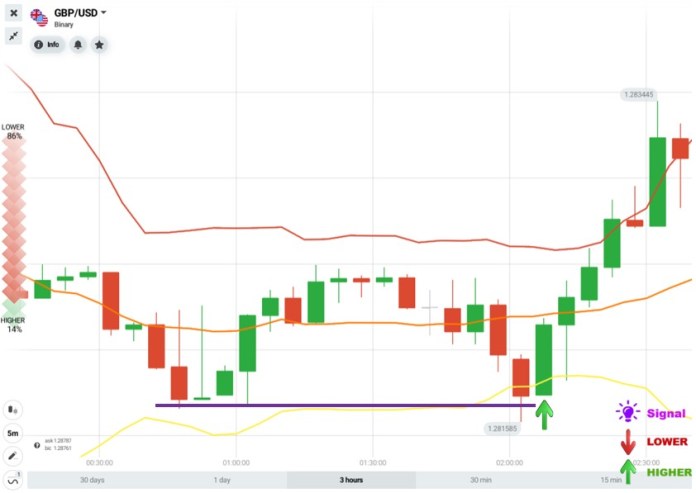
Bollinger Bands indicator with support/resistance
Trading guide:
Firstly, open a HIGHER option = The price touches or breaks the lower band + Support zone.
Explain: When the price touches or breaks the lower band, the reversal probability is high. When combining with the support level, it gives a safe signal to buy a HIGHER option.

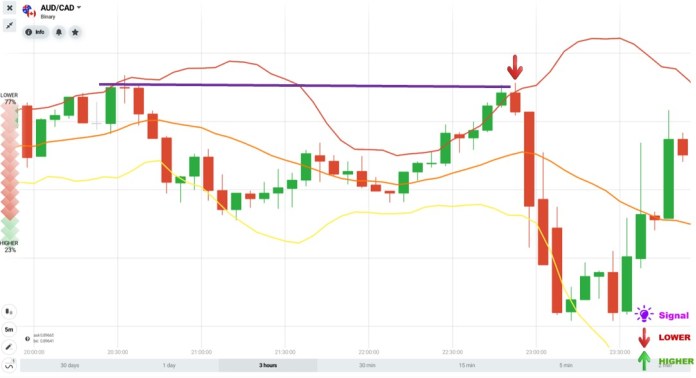
Secondly, open a LOWER option = The price touches or breaks the upper band + Resistance zone.

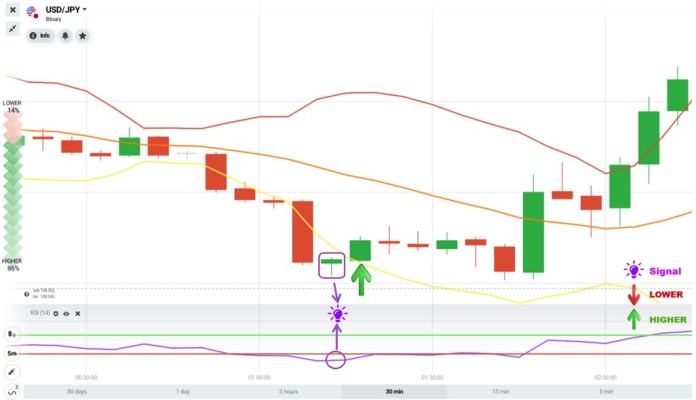
Bollinger Bands indicator with RSI indicator
Trading guide:
Open a HIGHER option = The price touches or breaks the lower band + RSI is in the oversold zone.
Explanation: When the RSI is in the oversold zone, the price will tend to reverse. Combine the signal that the price touches or breaks the lower band => Open a HIGHER option.

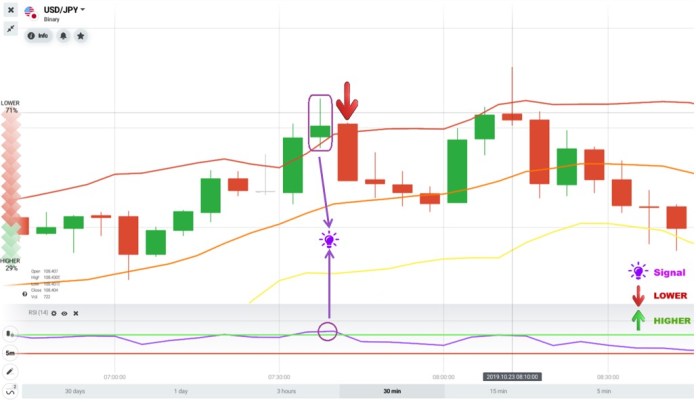
Open a LOWER option = The price touches or breaks the upper band + RSI is in the overbought zone.

Bollinger Bands indicator with reversal candlestick pattern Harami
Trading guide:
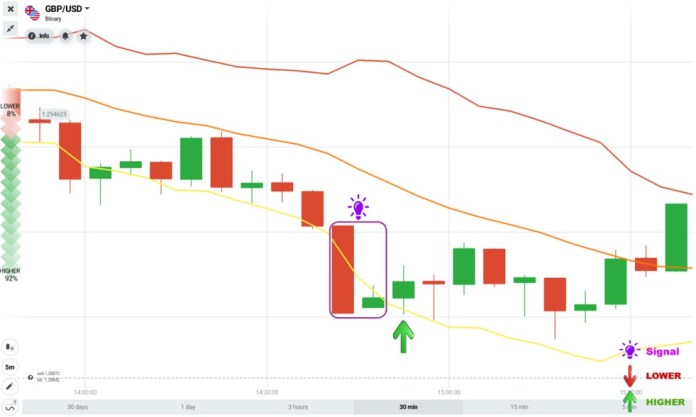
Firstly, open a HIGHER option = The price touches or breaks the lower band. Trading signal is Bullish harami candlestick pattern.

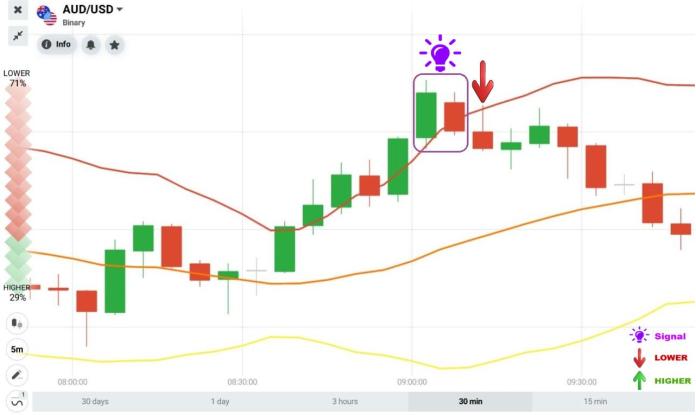
Secondly, open a LOWER option = The price touches or breaks the upper band. Trading signal is the Bearish harami candlestick pattern.

Conclusion
Bollinger Bands are considered as a reliable price corridor. The price will always move in Bollinger Bands, which creates safe and effective entry points.
Hence, you need to practice on your IQ Option Demo account seriously to have a good feeling about this indicator.
Register IQ Option and Get Free $10,000 Risk warning: Your capital might be at risk.
![]()
![]()
![]()
![]()
![]()
![]()
![]()
![]()
![]()
![]()
![]()
![]()
![]()
![]()
![]()
![]()
![]()
![]()
![]()
![]()
![]()