
![]()
![]()
![]()
![]()
![]()
![]()
![]()
![]()
![]()
![]()
![]()
![]()
![]()
![]()
![]()
![]()
![]()
![]()
![]()
![]()
![]()

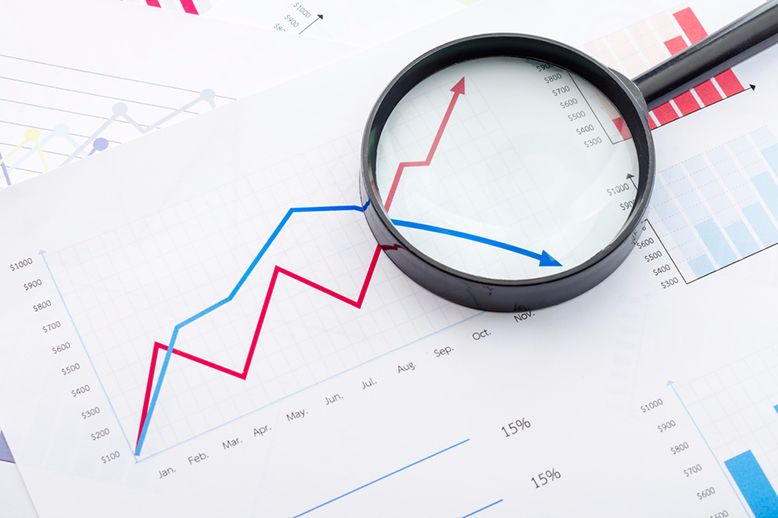
Trends or price trends are the most important thing in analyzing price charts. And capturing a price trend means that you have an 80% chance of winning in IQ Option trading. In this article, IQtradingpro will guide how to identify price trends and options trading in IQ Option.
Register IQ Option and Get Free $10,000 Risk warning: Your capital might be at risk.
What is the trend?
Trend is the movement of price in one direction for a long period. Therefore, after identifying the trend of the current price, you can easily predict its direction in the future.
Trends are divided into 3 types: Uptrend, Downtrend and Sideways trend.

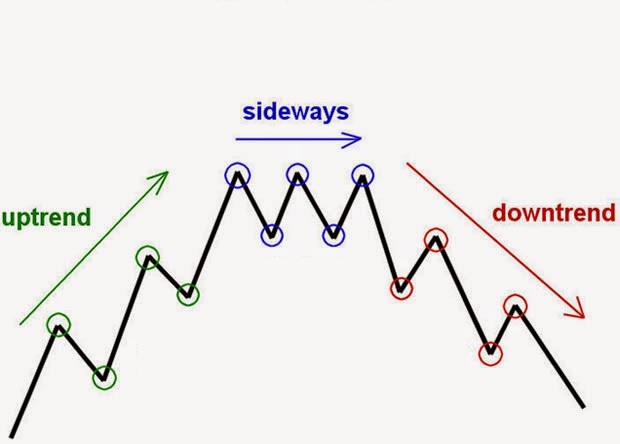
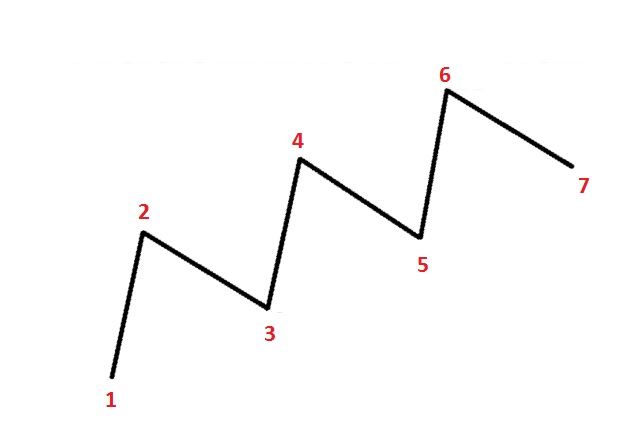
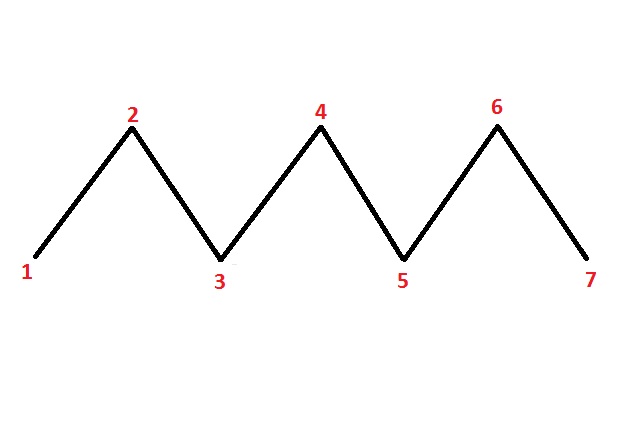
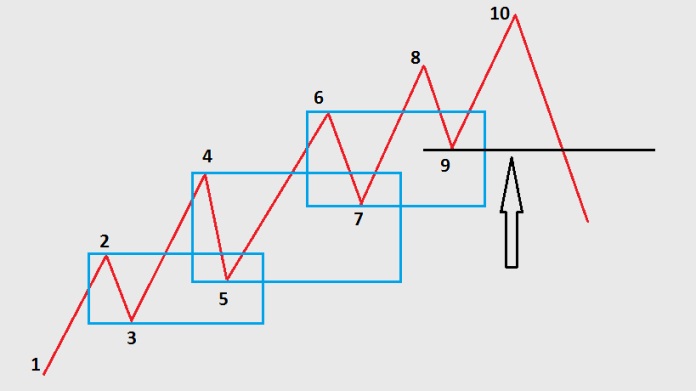
Uptrend
An uptrend is formed when the price increases continuously. It creates the next bottoms and tops that are higher than the previous ones.
Specifically:
• 3rd bottom is higher than the 1st bottom. The 5th bottom is higher than the 3rd bottom.
• 4th top is higher than the 2nd top. The 6th top is higher than the 4th top.
=> This is an uptrend.

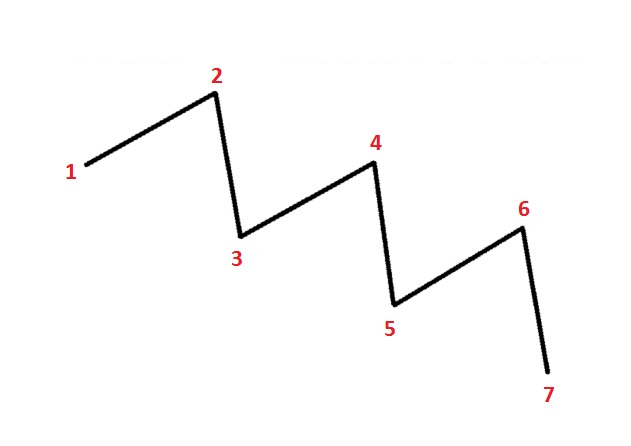
Downtrend
A downtrend is formed when the price keeps falling. It creates the next tops and bottoms that are lower than the previous ones.
For example,
• 4th top is lower than the 2nd one. The 6th top is lower than the 4th.
• 3rd bottom is lower than 1st bottom. The 5th is lower than the 3rd.
=> This is a downtrend.
Sideways
Most of the time the market will be in a sideways trend. The price has been moving sideways for a long time to make the following tops equal to the previous one. The same goes for the bottoms. Professional traders won’t trade when the price goes sideways.
For example,
• 2nd, 4th and 6th top are equal.
• 1st, 3rd and 5th bottom are equal.
=> Sideways market.
Signs when a trend is broken
Naturally, the trend only exists for a certain time. Thus, you need to know the knowledge to identify trend reversal signals.
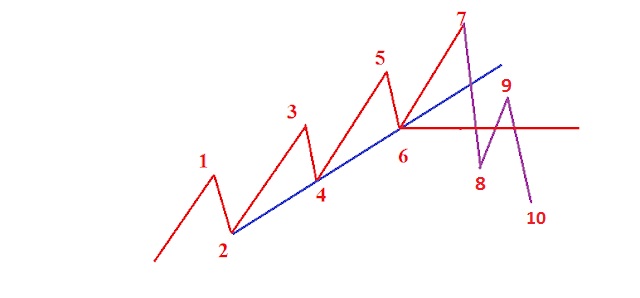
Sign 1: When the rules are no longer true
For example, the price is in an uptrend. As we said above, the next bottoms and tops are higher than the previous ones. But suddenly this rule was broken.
The next bottom is lower than the previous one. And the next top is also lower than the previous top. This is the sign of a trend reversal => The market will change from an uptrend to a downtrend.

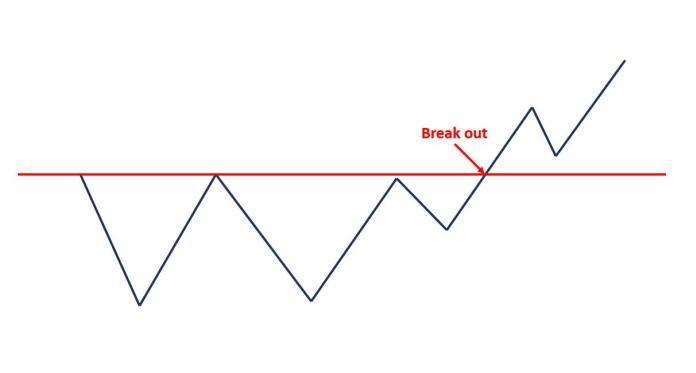
Signal 2: The price moves sideways and creates break out points
The price goes sideways and accumulates for a long time. Then it breaks out of that sideways trend to develop a new one.

Trendline and price trend are not the same
Many articles show that you only need to use Trendline (a straight line) to connect the bottoms (uptrend) or tops (downtrend). That’s how to identify a trend. Ideally, this is it.

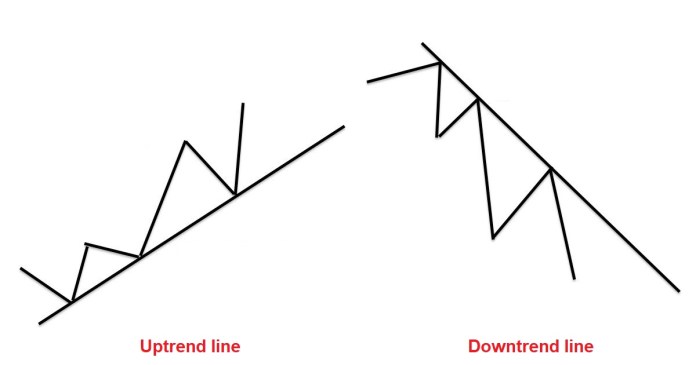
But in fact, the price never moves like that. It still satisfies the conditions of Uptrend. But you can’t draw a trendline to connect these bottoms together.

Therefore, it is not always possible to use Trendline to identify price trends. Just use Trendline as a tool to make it easier to predict and open options in IQ Option.
How to trade options with trends in IQ Option
Basically, the formula for trading options will be to identify the main price trend, then look for signals to buy options.
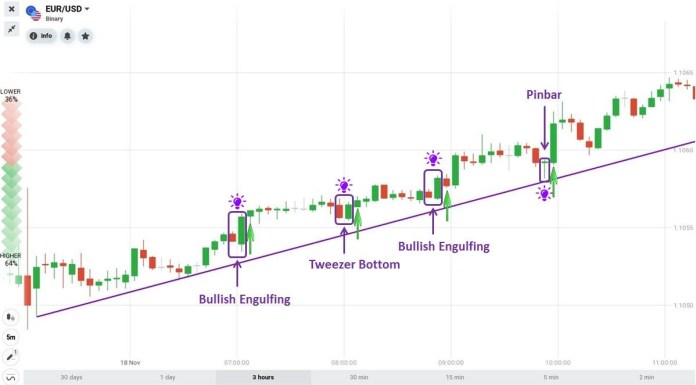
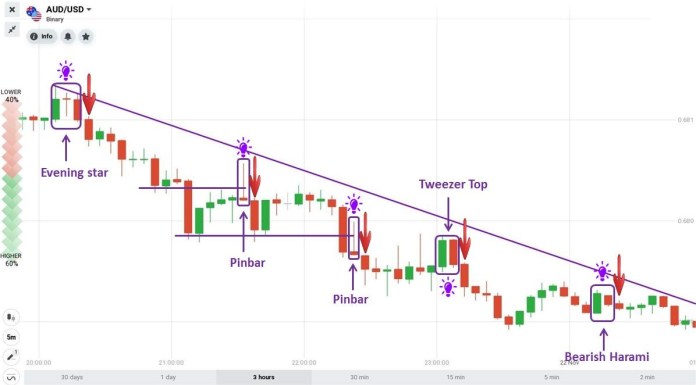
Rules: In an uptrend, just wait for the signal to buy HIGHER options. On the contrary, in the downtrend, wait for the signal to buy LOWER options. Except for the sideways trend => Do nothing.
In this tutorial, I will combine Trend and Signal (Candlestick/candlestick pattern). These are candlesticks or special candlestick patterns famous for their names as reversal candlestick patterns. But when combining with Trend, we can use it as retracement candlestick patterns that continue the price trend.
Requirements: Japanese 5-minute candlestick pattern. The expiration time is 15 minutes or more.
Trading technique:
HIGHER = Uptrend + Bullish candlestick pattern (Bullish Engulfing, Tweezer Bottom, Bullish Pin Bar, etc)

LOWER = Downtrend + Bearish candlestick pattern (Evening Star, Tweezer Top, Bearish Pinbar, Bearish Harami, etc)
You should use the demo account to test the strategies around the price trend. It’s not only to experience but also to draw for yourself a specific trading method in IQ Option. In the following articles, we will only use this trading method to make money in IQ Option. Good luck!
Register IQ Option and Get Free $10,000 Risk warning: Your capital might be at risk.
![]()
![]()
![]()
![]()
![]()
![]()
![]()
![]()
![]()
![]()
![]()
![]()
![]()
![]()
![]()
![]()
![]()
![]()
![]()
![]()
![]()