The post IQ Option 의 트위저 캔들 스틱 패턴으로 안전하게 수익을 창출하세요 appeared first on IQ Trading Pro.
]]>IQ Option 등록하고 $10,000를 무료로 받으세요 Risk warning: Your capital might be at risk.
Choose the right trend for the Tweezer candlestick pattern (tweezer top, tweezer bottom, or railroad track)
Don’t take the trend lightly. It is one of the most important factors that will help you win. The trend identification plus signals from the candlestick pattern provide a good entry point.
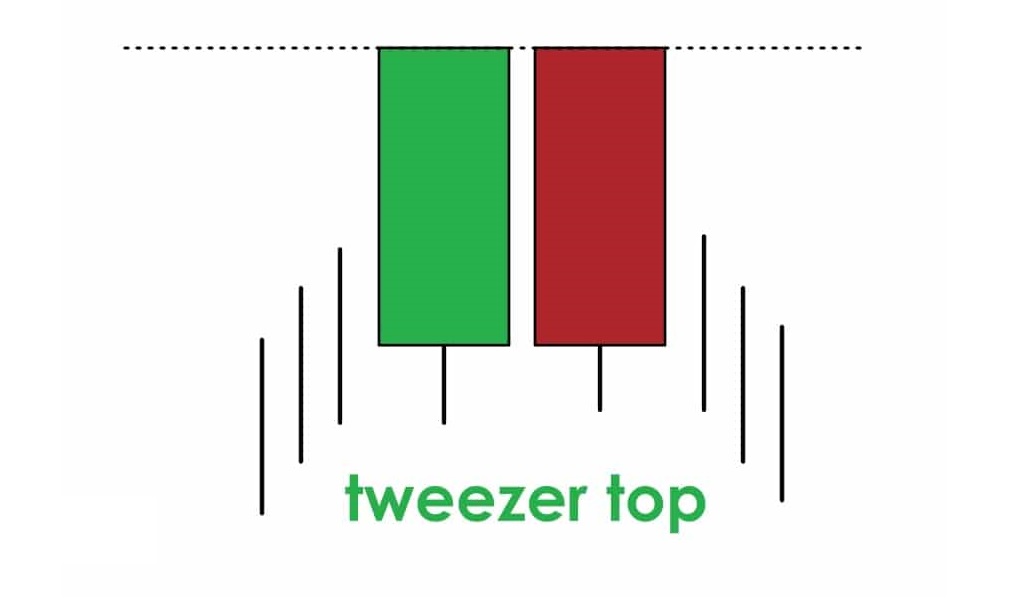
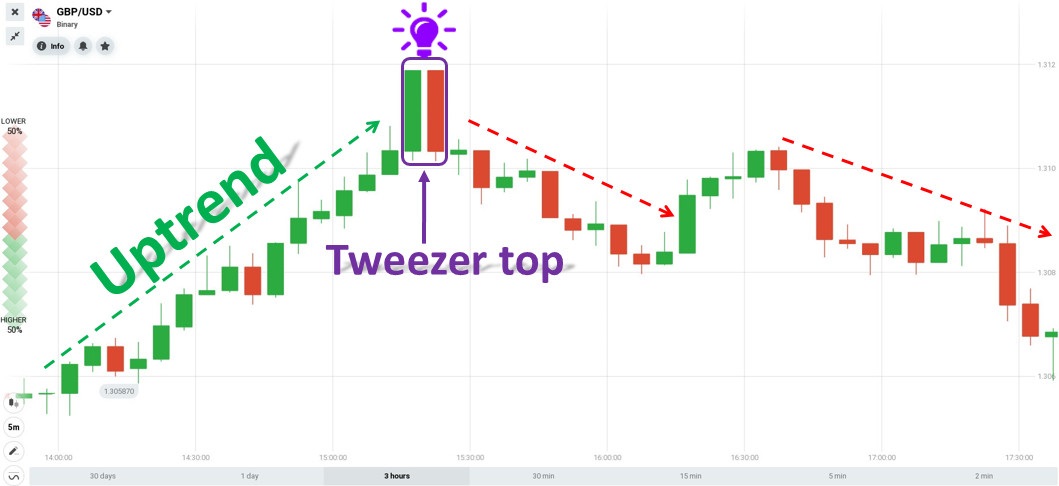
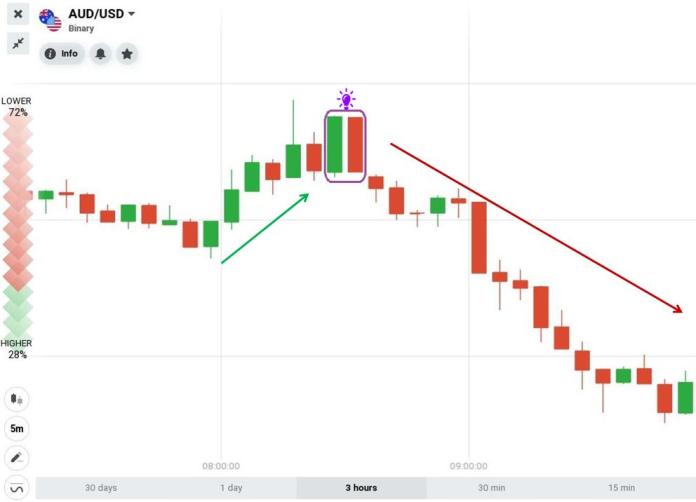
– Uptrend + Tweezer Top => The price is about to reverse from bullish to bearish.
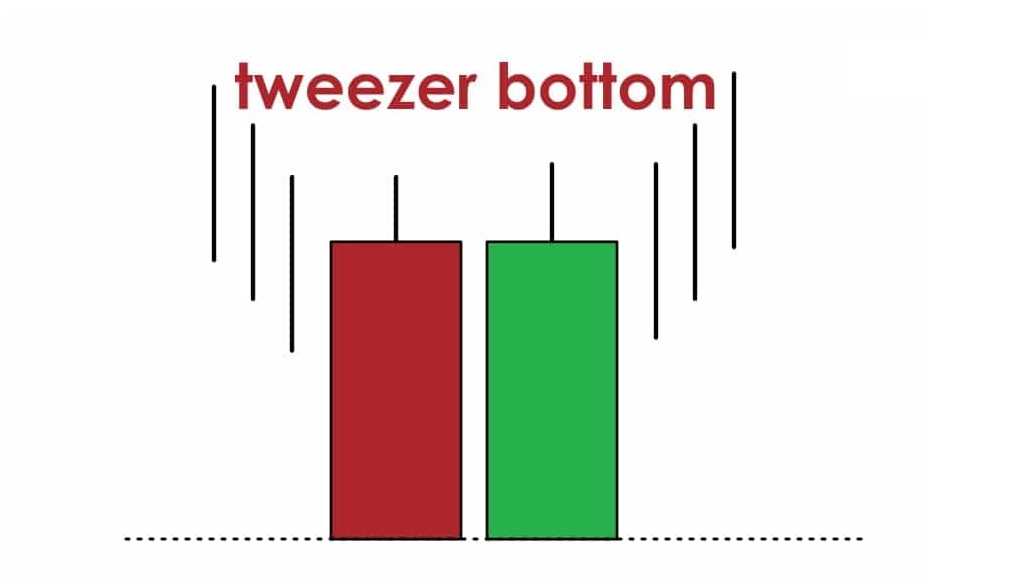
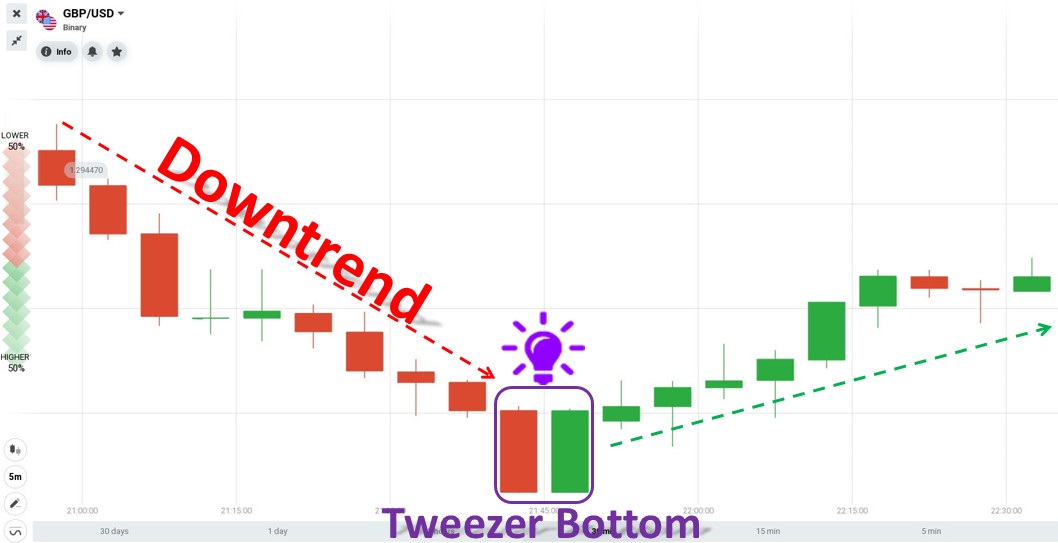
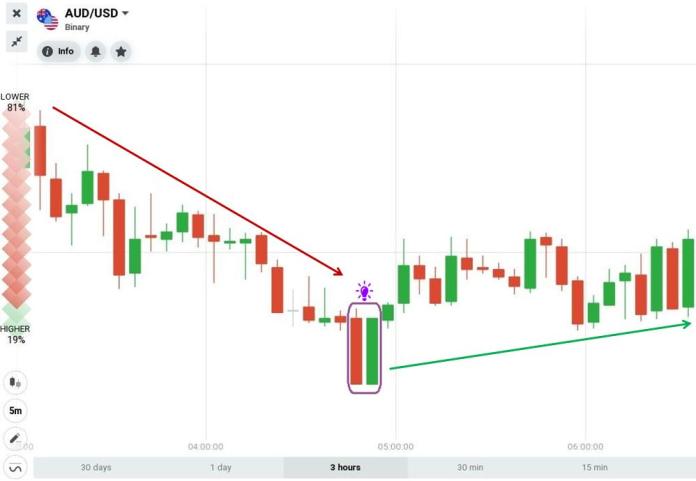
– Downtrend + Tweezer Bottom => The price is about to reverse from bearish to bullish.
Markets without trends will cause your predictions to be inaccurate. So I will not open orders when the market is sideways.
How to open an order with the Tweezer candlestick pattern
Candlestick patterns all need a suitable trend to be effective. It is like a boost to increase your odds of winning. Trends are gifts given by “Mr. Market”. Accept those gifts because inside them is your profit.
Open a HIGHER order when: The Tweezer Bottom candlestick pattern appears in a downtrend.
Open a LOWER order when: The Tweezer Top candlestick pattern appears in an uptrend.
Apply capital management to leverage the power of probability
The financial game is likened to by many traders as a game of probability. You can choose the entry point with the highest probability of winning when you are a patient person. On the contrary, you will face high risks when you follow no principle and discipline.
Gone are the days of investment-multiplying orders (Martingale) that give your account immortality. In fact, those are the classic lies that make newbies think they will never lose.
Then one day, the market will prove that nothing is immortal over time. As a result, you will receive a valuable lesson paid for by the money in your account.
Right now, we need security plus the power of probability to make sure profits. And the Classic capital management method (balanced investment) will give you that.
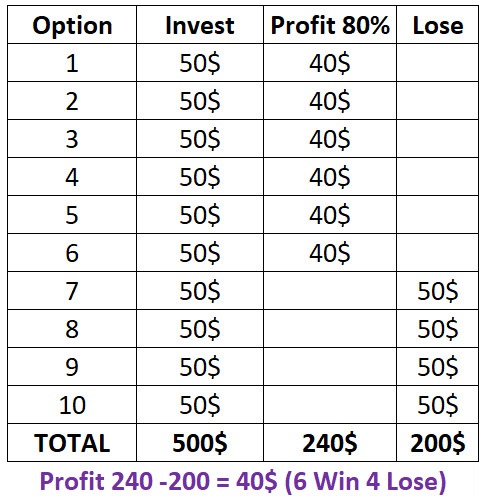
With the odds of random increases or decreases, the odds of winning or losing are within 50%. Then, adding a few indicators along with good discipline will give a win rate above 60%.
Review on entry points with the Tweezer candlestick pattern
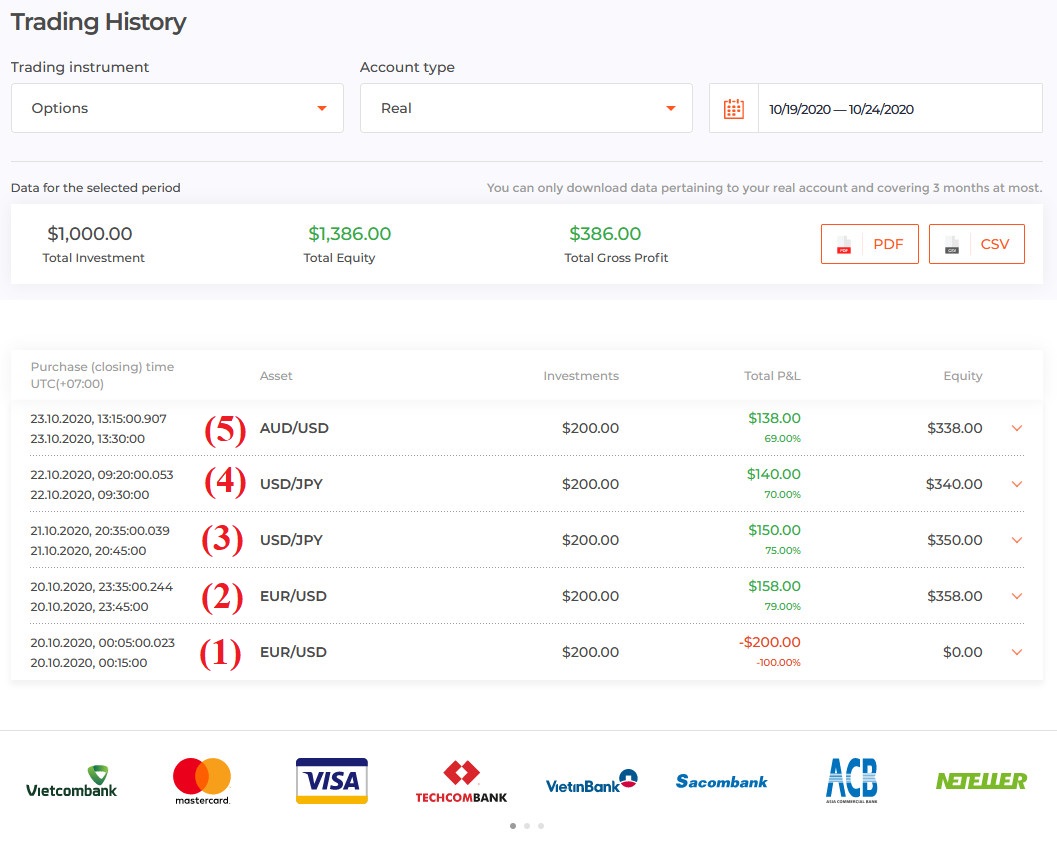
Conditions: A 5-minute Japanese candlestick chart. Open orders with an expiration time of 10 minutes to 25 minutes.
Currency pairs: USD/JPY, EUR/USD, AUD/USD.
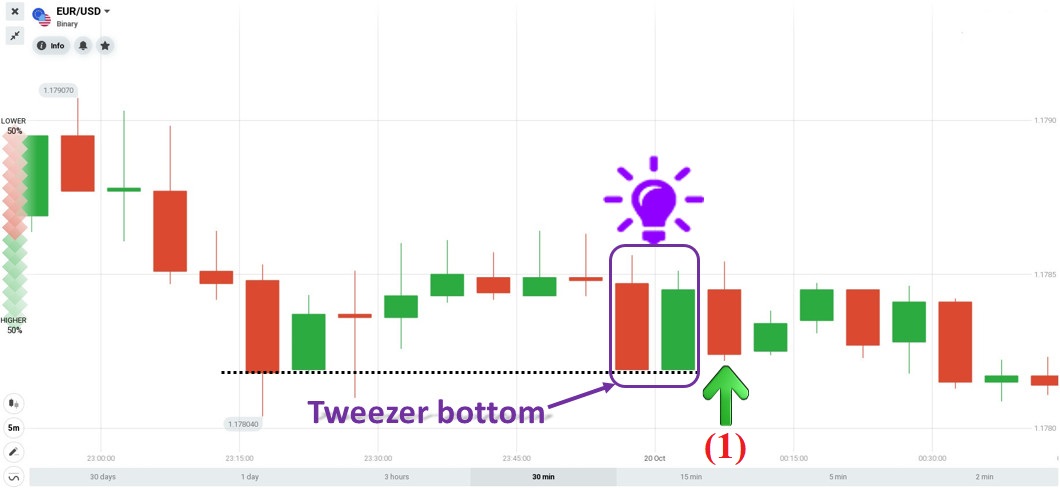
1st order: On October 20, the EUR/USD pair formed a Tweezer Bottom candlestick pattern at the support zone. Opened a HIGHER order with an expiration time of 10 minutes for $200 => I lost.
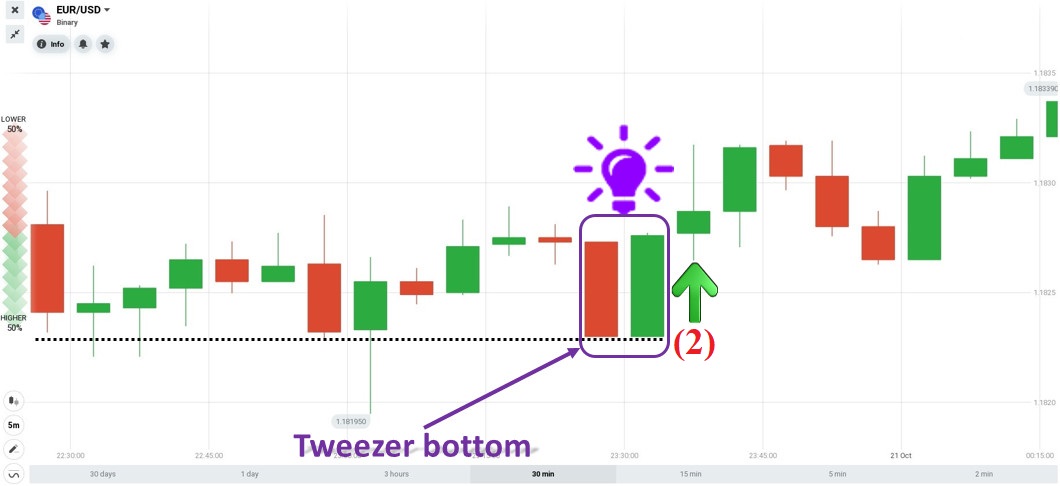
2nd order: On October 20, also with the EUR/USD pair, the Tweezer Bottom pattern appeared at the support zone. Opened a HIGHER order with an expiration time of 10 minutes => I won.
3rd order: On October 21, with the USD/JPY, at the resistance zone, a Tweezer Top candlestick pattern appeared. Opened a LOWER order with an expiration time of 10 minutes => I won.
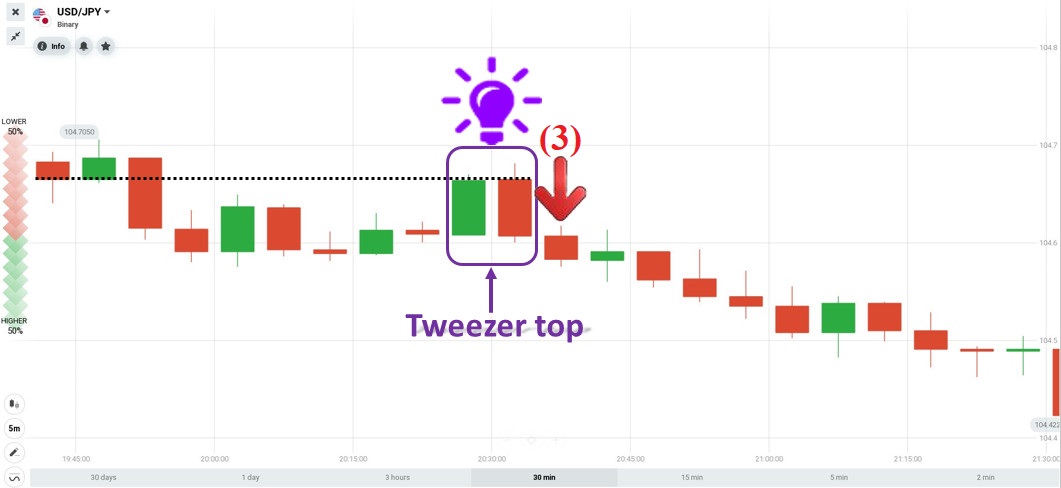
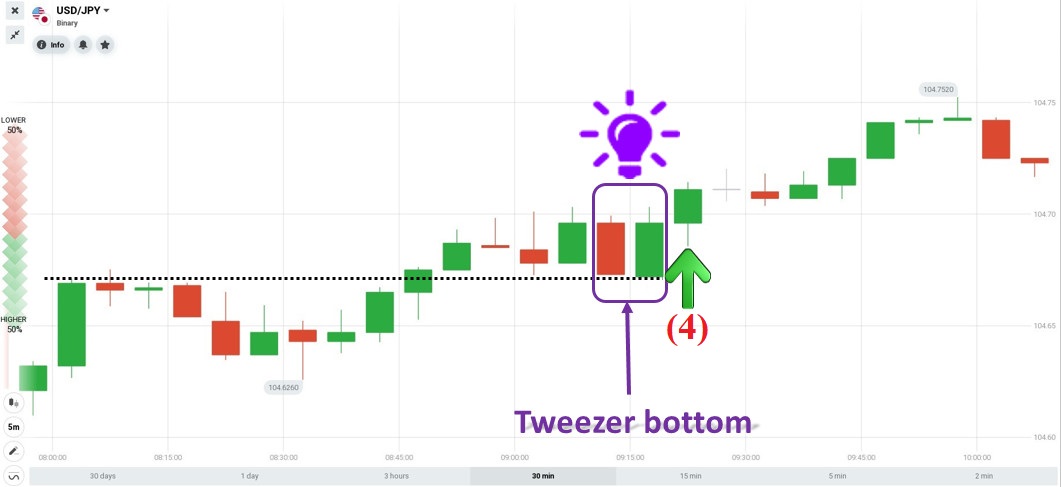
4th order: On October 22, with the USD/JPY pair in an uptrend, the Tweezer Bottom candlestick pattern appeared at the support zone. Placed a HIGHER order with an expiration time of 10 minutes => I won.
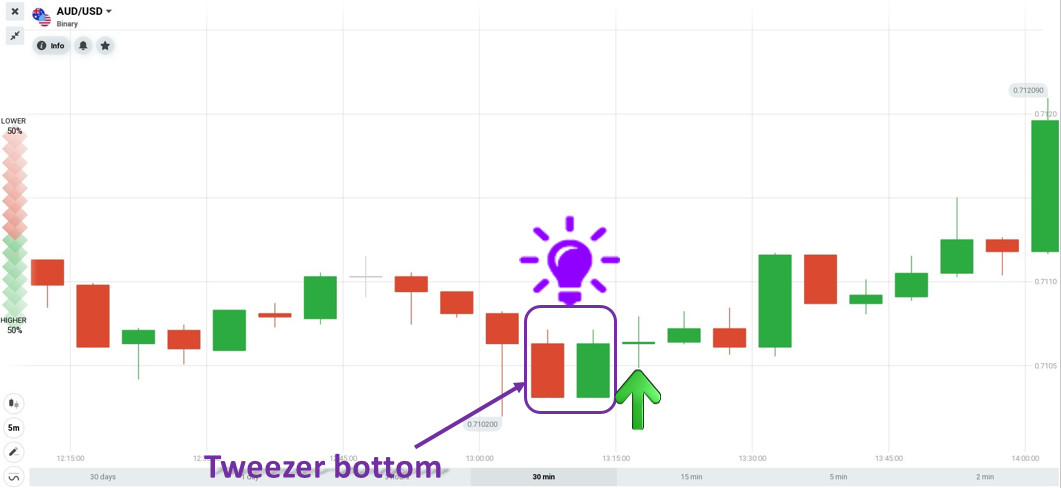
5th order: On October 23, with the AUD/USD pair, a Tweezer bottom pattern appeared. Before that, there had been a Bullish Pin Bar candle with a long lower tail, showing that the bearish force had weakened. Opened a HIGHER order with an expiration time of 15 minutes => I won.
In conclusion
Be cold-blooded hunters with deadly shots that quickly destroy the prey. Don’t think about what to do with the trophies before you start your hunt. Just focus 100% on the process, the rewards will come when you do your job well.
Now you have one more strategy to make money from IQ Option with the Tweezer candlestick pattern. Add it to your test list before bringing it into action. It is up to you if you can convert a recipe into a chicken that lays golden eggs. Wish you success.
IQ Option 등록하고 $10,000를 무료로 받으세요 Risk warning: Your capital might be at risk.
The post IQ Option 의 트위저 캔들 스틱 패턴으로 안전하게 수익을 창출하세요 appeared first on IQ Trading Pro.
]]>The post IQ Option 에서 식별하고 거래하는 방법 appeared first on IQ Trading Pro.
]]>IQ Option 등록하고 $10,000를 무료로 받으세요 Risk warning: Your capital might be at risk.
트위저 캔들 스틱 패턴이란?
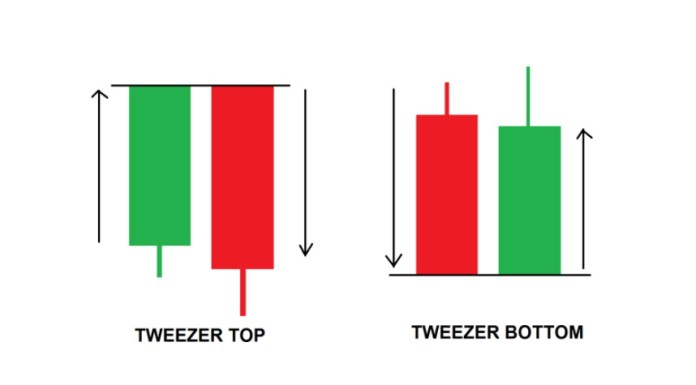
핀셋 캔들 패턴 (핀셋 상단 / 핀셋 하단이라고도 함)은 반전 캔들 패턴입니다. 일반적으로 상승 또는 하락 가격 추세의 상단 또는 하단에 나타납니다. 색상이 반대이고 길이가 거의 같은 두 개의 긴 Candlesticks IQ Option 거래 중 반전 신호로 간주됩니다.
Tweezer 캔들 스틱 패턴은 어떻게 작동합니까?
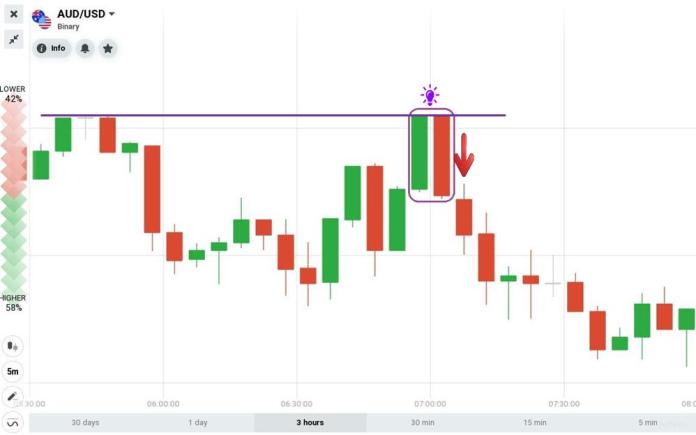
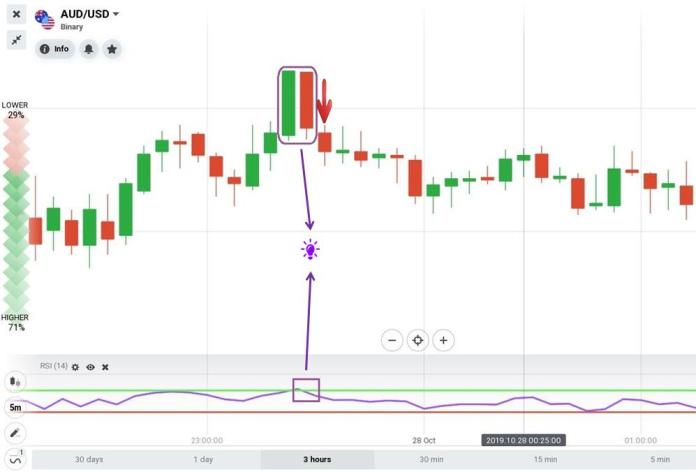
핀셋 탑
핀셋 탑은 상승 추세 끝에 나타나는 Candlesticks
• 첫 번째 촛대는 녹색입니다. Candlesticks 보다 길어 가격이 급등했음을 알 수 있습니다.
• 두 번째 촛대는 빨간색입니다. 녹색 촛대와 거의 비슷합니다. 시가는 첫 번째 캔들의 종가와 같습니다. 가격이 갑자기 떨어졌습니다. 이것은 추세가 상향에서 하향으로 반전된다는 신호입니다.
핀셋 바닥
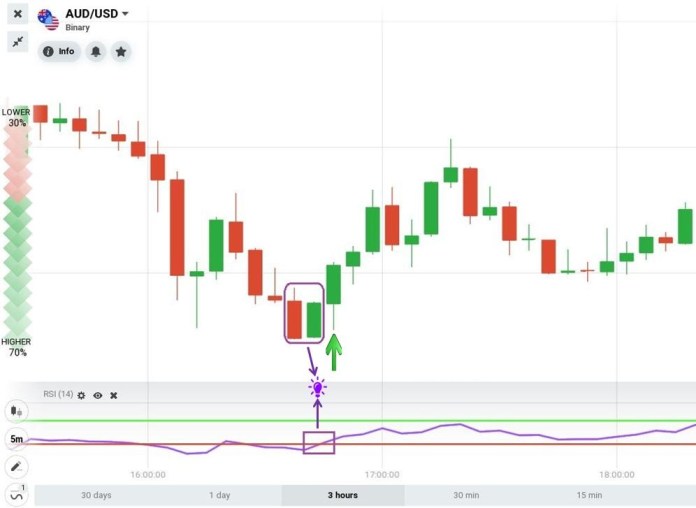
Tweezer Bottoms는 하락세 끝에 나타나는 캔들 스틱 패턴입니다.
• 첫 번째 촛대는 빨간색으로 이전 Candlesticks 비해 길이가 동일합니다. 가격이 급격히 하락하고 있음을 보여줍니다.
• 두 번째 촛대는 녹색입니다. 첫 번째 캔들의 종가와 동일한 시가가 있습니다. 길이는 이전의 빨간색 촛대와 거의 같습니다. 가격이 갑자기 하락에서 상승으로 반전되었습니다.
Tweezer 촛대 패턴을 사용한 IQ Option
트위저 캔들 패턴은 반전 캔들 패턴입니다. 따라서 다른 반전 지표와 결합해야합니다. IQ Option 에서 거래 할 때 정확성을 높이는 것입니다.
전략 1 :지지 및 저항 수준과 함께 Tweezer 캔들 스틱 패턴 사용
요구 사항 : 5 분 양초 차트 + 핀셋 캔들 패턴. 만료 시간은 15 분입니다.
거래 가이드 :
HIGHER = 족집게 바닥 촛대 패턴 및지지 수준.
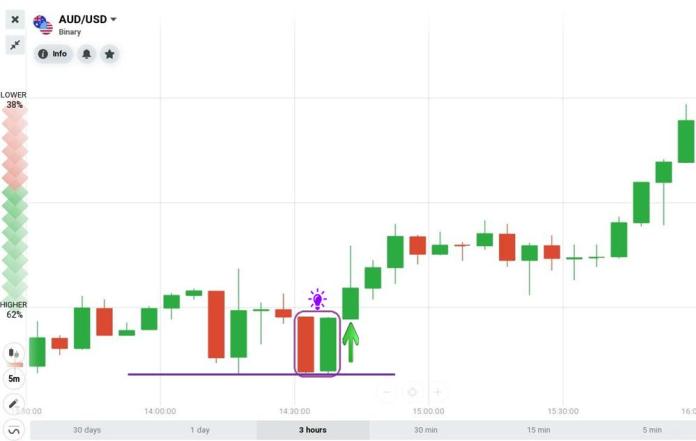
LOWER = 핀셋 상판 및 저항 수준.
전략 2 : RSI 지표 와 함께 Tweezer 캔들 스틱 패턴 사용
RSI 지표는 시장 동향을 정확하게 파악할 수있는 효과적인 지표입니다. 또한 추세 반전 지점을 보여줍니다. 그렇기 때문에 Tweezer 캔들 패턴과 결합하기에 적합합니다.
요구 사항 : 일본 5 분 캔들 차트 + 핀셋 캔들 패턴 + RSI 표시기. 만료 시간은 15 분입니다.
거래 가이드 :
HIGHER = Tweezer Bottoms 캔들 스틱 패턴과 과매도 영역의 RSI.
LOWER = Tweezer Tops 캔들 패턴과 과매 수 영역의 RSI.
결론
핀셋 촛대 패턴은 다양한 지표와 결합 할 수 있습니다. 다음 기사에서 이러한 전략을 소개하겠습니다. 이러한 캔들 스틱 패턴을 경험하려면 IQ Option 에서 데모 계정을 등록하십시오. 행운을 빕니다!
IQ Option 등록하고 $10,000를 무료로 받으세요 Risk warning: Your capital might be at risk.
The post IQ Option 에서 식별하고 거래하는 방법 appeared first on IQ Trading Pro.
]]>