In the trading market, traders are familiar with the terms such as trend, overbought and oversold. These are the zones that have a high trend reversal rate. If you can use CCI indicator to choose the right entry points, your chance of winning is very high.
CCI indicator satisfies these requirements quickly and accurately. This article will show you how CCI works and how to use it to trade options in IQ Option.
Register IQ Option and Get Free $10,000 Risk warning: Your capital might be at risk.
What is CCI indicator?
CCI stands for Commodity Channel Index. It is an indicator used in technical analysis of financial markets. CCI also belongs to the group of oscillating technical indicators.
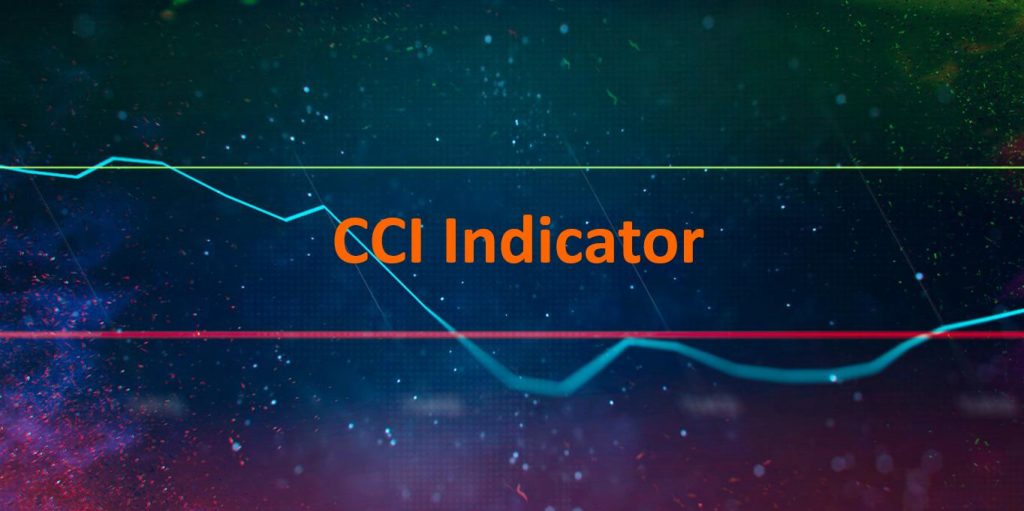
CCI indicator oscillates between +100 and -100 fixed levels. When the indicator rises above +100 or drops below -100, it signals overbought and oversold conditions.
(1) Uptrend.
(2) The price goes up but CCI falls (also known as the bearish divergence). In short, it’s the reversal signal from uptrend to downtrend.
(3) Downtrend.
How does CCI indicator work?
(i) CCI is used to identify trends
When using CCI, you can see the momentum is renewed every time CCI drops below -100. If the indicator starts rising above -100, the trend will continue. It also shows that the trend is getting stronger.
(ii) Use CCI divergence to identify trend reversals
CCI divergence is the phenomenon of CCI indicators moving against the price. It means the price increases but CCI momentum indicator decreases. Or vice versa, the price decreases but CCI increases.
For example, the price is in an uptrend but CCI is falling. This is considered a divergence => A trend reversal is about to happen from upward to downward.
IQ Option trading strategy with CCI indicator
CCI indicator is a momentum indicator that tells us whether a trend is strong or weak. Therefore, the best way to trade in IQ Option is to buy options that are 15 minutes or longer when a strong trend is identified.
Tactic 1: Heiken Ashi candlestick chart combines with CCI indicator
CCI indicator is an effective indicator when identifying trends. Thus, it should combine with Heiken Ashi candlestick chart to increase accuracy.
Requirements: 5-minute Heiken Ashi candlestick chart + CCI. And the expiration time is 15 minutes or more.
Trading tactics:
Open HIGHER options = Heiken Ashi candlestick chart turns from red to green + CCI is below -100 (red) then moves up and cuts -100.
Open LOWER options = Heiken Ashi candlestick chart turns from green to red + CCI is above +100 (green) then moves down and cuts +100.
Tactic 2: CCI divergence works with candlestick patterns
In case CCI divergence appears in the overbought or oversold zone, it gives safe entry points when working with a strong reversal candlestick pattern.
Requirements: Japanese 5-minute candlestick chart + CCI. Besides, the expiration time is 15 minutes or more.
Trading tactics:
HIGHER = CCI divergence occurs in the oversold zone + Morning Star candlestick pattern.
LOWER = CCI divergence occurs in the overbought zone + Tweezer Top candlestick pattern.
In the next articles, we will update more strategies of CCI indicator for you. Please follow us at Iqtradingpro.
Register IQ Option and Get Free $10,000 Risk warning: Your capital might be at risk.
