
 English
  Indonesia
  Português
  Tiếng Việt
  ไทย
ไทย  العربية
  हिन्दी
  Nederlands
  Français
  Deutsch
  हिन्दी
  Italiano
  한국어
한국어  Melayu
  Norsk bokmål
  Русский
  Español
  Svenska
  Tamil
Tamil  Türkçe
  Zulu
Zulu
Stochastic震荡指标是分析和确认价格趋势的非常有效的指标。同时,在“ IQ Option , Stochastic震荡指标还向打开的选项提供安全信号。
在本文中,我将详细指导如何使用Stochastic震荡指标。此外,周围还有特定的IQ Option交易技术。
注册IQ Option并免费获得10,000美元 Risk warning: Your capital might be at risk.
什么是Stochastic震荡指标?
Stochastic震荡指标(被称为Stochastic )是动量指标。它将特定时间段内的收盘价与特定价格范围进行比较。
Stochastic震荡指标显示价格走势。在技术分析中,动力总是先于价格。因此,这是我们使用Stochastic预测价格走势的基础。
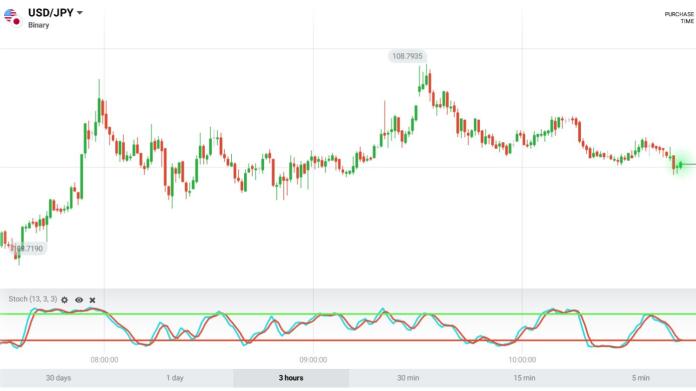
IQ Option的Stochastic震荡指标的结构包括4行
2条移动线包括:
•主线称为%K线(绿色)。
•剩下的行是%D行(红色)。这是%K的移动平均值。
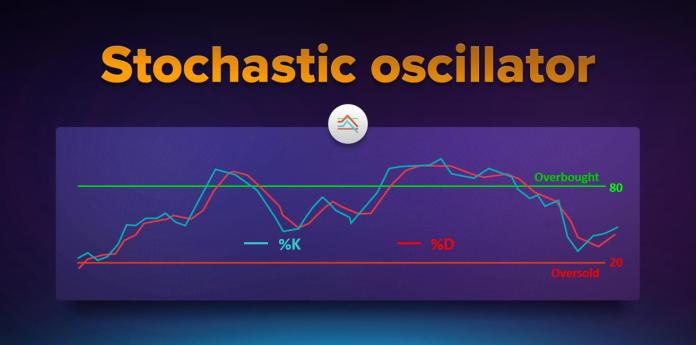
2条水平固定线分别为80和20。
•当Stochastic高于80时,市场进入超买区域。
•当Stochastic低于20时,市场进入超卖区域。
Stochastic震荡指标-它是如何工作的?
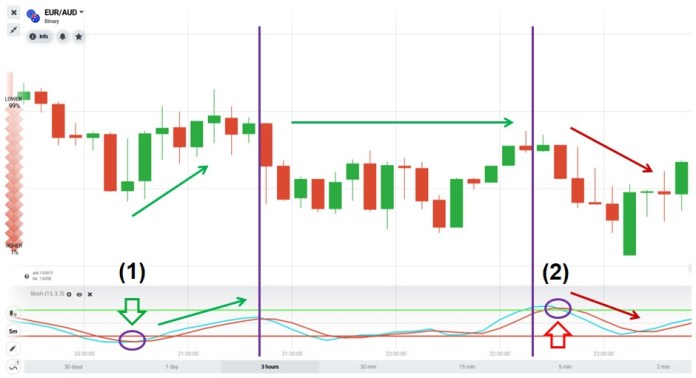
(i)从Stochastic震荡指标交叉确认价格趋势。
Stochastic震荡指标始终在0到100之间。超买80,超卖20。
•(1)当%K从20以下(超卖区)越过%D并上升时。 =>价格趋于上涨。
•(2)相反,当%K从80以上(超买区域)越过%D并下降时。 =>价格趋于下降。
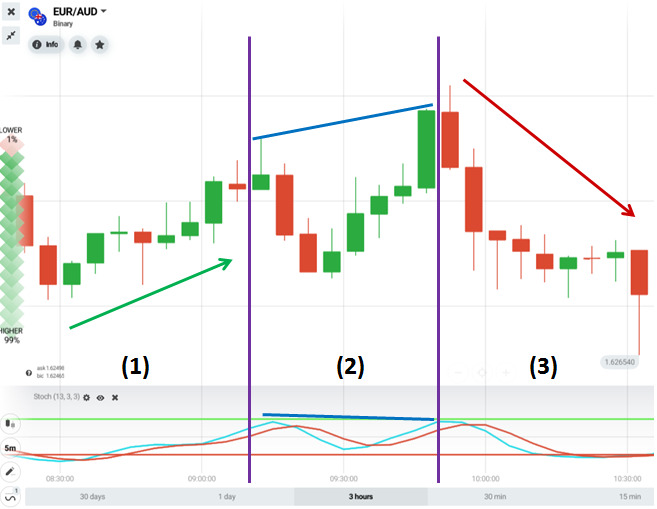
(ii) Stochastic震荡指标发散
当指标与价格背道而驰时, Stochastic这意味着价格上涨,但斯托克指标下降。反之亦然,价格下降,但斯托克指标增加。
例如,
•(1)价格处于上升趋势。
•(2) Stochastic震荡指标发散。价格上涨,但Stochastic震荡指标下降。
•(3)市场从上升转为下跌。
如何IQ Option Stochastic震荡指标
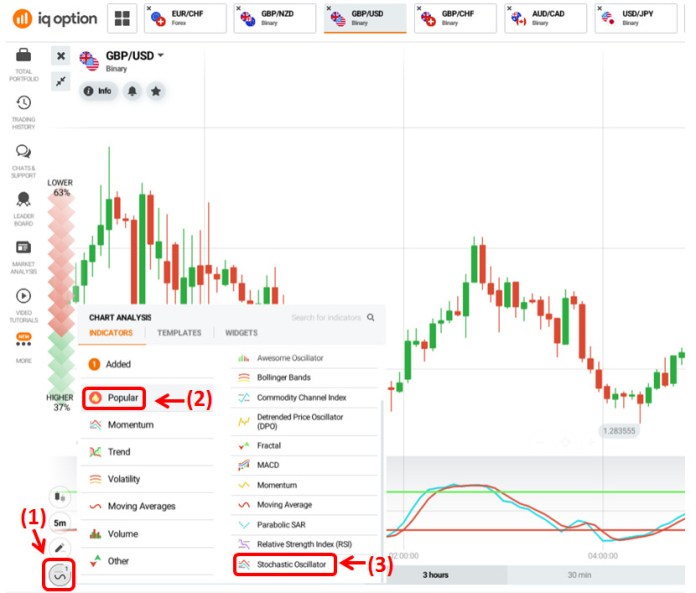
创建Stoch指标。 (1)单击指标框=>(2)流行标签=>(3)选择Stochastic震荡指标。
如何在IQ Option Stochastic
Stochastic震荡指标是动量指标。因此,它给出的交易信号早于市场价格。 IQ Option交易的最佳方法是打开长期期权。
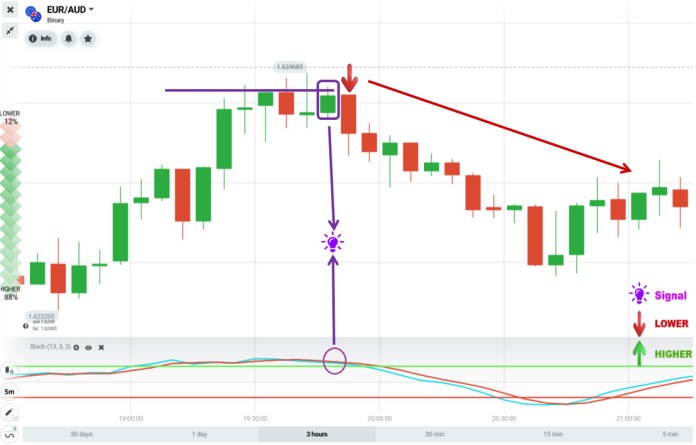
技术1:将Stochastic振荡器与支撑和阻力相结合
如果您不知道如何确定或得出支撑位和阻力位,则可以查看以下文章。支持和阻力–买卖IQ Option时的最佳技术指标。
要求:5分钟的日本烛台图+ Stochastic震荡指标。另外,有效时间为15分钟以上。
交易技巧:
更高=价格进入支撑区域+ Stochastic震荡指标处于超卖区域。
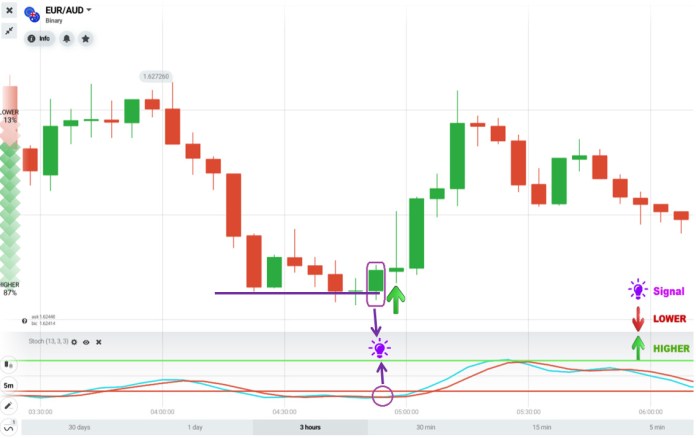
更低=价格进入阻力区+ Stochastic震荡指标处于超买区域。
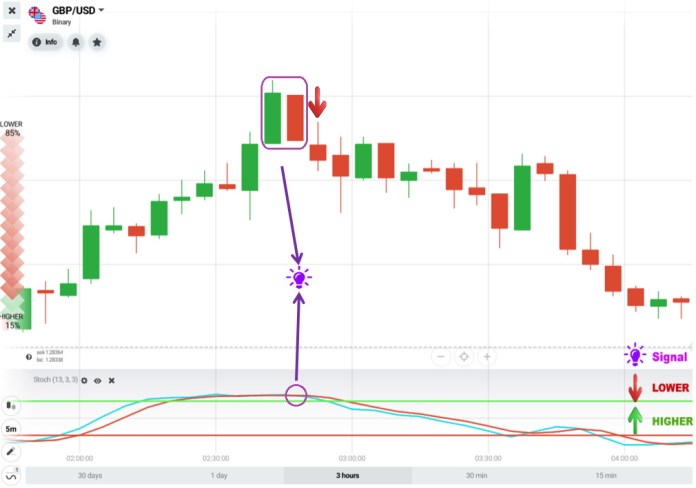
方法2:将Stochastic震荡指标与反转烛线形态结合使用
要求:日本5分钟烛台图+ Stochastic震荡指标。到期时间也为15分钟或更长。
注意:交易信号是趋势反转烛形图,出现在Stochastic震荡指标处于超买或超卖区域时。
交易技巧:
较高=牛市Harami烛台形态+ Stochastic震荡指标低于20(超卖)。
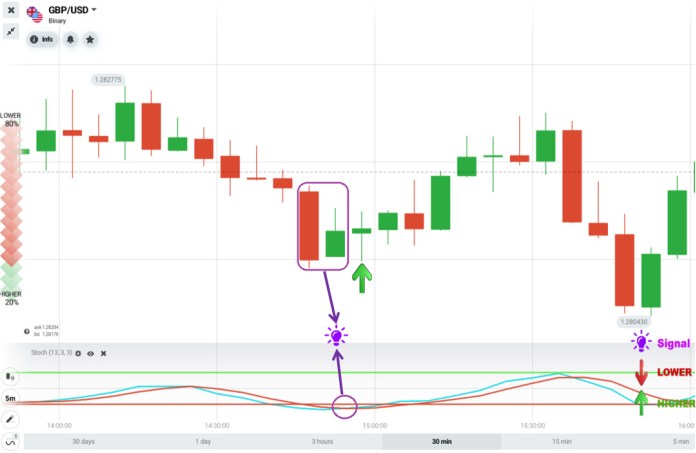
更低=看跌Harami烛台形态+ Stochastic震荡指标高于80(超买)。
此外,仍有许多方法与Stochastic震荡指标IQ Option交易。您可以使用下面的注册框,使用您的IQ Option爱!
注册IQ Option并免费获得10,000美元 Risk warning: Your capital might be at risk.
English Indonesia Português Tiếng Việt ไทย العربية हिन्दी Nederlands Français Deutsch हिन्दी Italiano 한국어 Melayu Norsk bokmål Русский Español Svenska Tamil Türkçe Zulu


