 English
  Indonesia
  Português
  Tiếng Việt
  ไทย
ไทย  العربية
  हिन्दी
  简体中文
简体中文  Nederlands
  Français
  Deutsch
  हिन्दी
  Italiano
  한국어
한국어  Melayu
  Norsk bokmål
  Español
  Svenska
  Tamil
Tamil  Türkçe
  Zulu
Zulu
America is voting for a president. Only one of two parties will be chosen which are Democracy and Republic. Citizens will choose a representative who, when coming to power, will bring the good of the country. It is the same in trading. Between candlestick and chart patterns, you have to choose a strategy that best suits you to make money in IQ Option. Now let’s find the optimum in each pattern, especially the Triangle pattern.
Do candlestick patterns or chart patterns offer higher precision?
This is an eternal question that has been discussed and dissected a lot on trading forums. Whether candlestick patterns or price patterns are the best things for traders, for me, it depends on the perspective of different people. Each trading strategy has its own advantages and disadvantages, so it cannot be evaluated subjectively (I am a Forex trader according to chart patterns).
Candlestick patterns offer high precision in the short to medium term
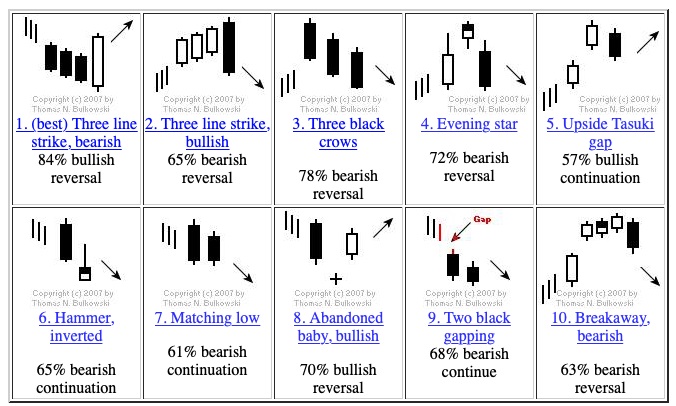
Candlestick patterns in trading are like fast food. They have a short lead time and are immediately effective for those who use it. It makes traders feel satisfied when quickly making money.
Short-term trades never deliver the stability that traders aim for. It takes long-term strategies to be successful. Fast food is the same. It solves hunger instantly and gives you a feeling of comfort, but in the long-term, it is not a good thing.
A candlestick pattern is a good choice for short to medium term Forex trades. You will need a reasonable stop-loss and take-profit strategy, along with good trading psychology. That’s all you need to be able to make money in IQ Option.
Chart patterns are a powerful weapon in the long run
To get a standard chart pattern, the market has to last over a few days, weeks, even months. From those up and down price paths, traders will redraw and make predictions for each pattern. The fact that it is formed over a long period gives you a lot of time to prepare well for your trade. It also somewhat restricts you from opening too many orders as they only appear twice or three times a month.
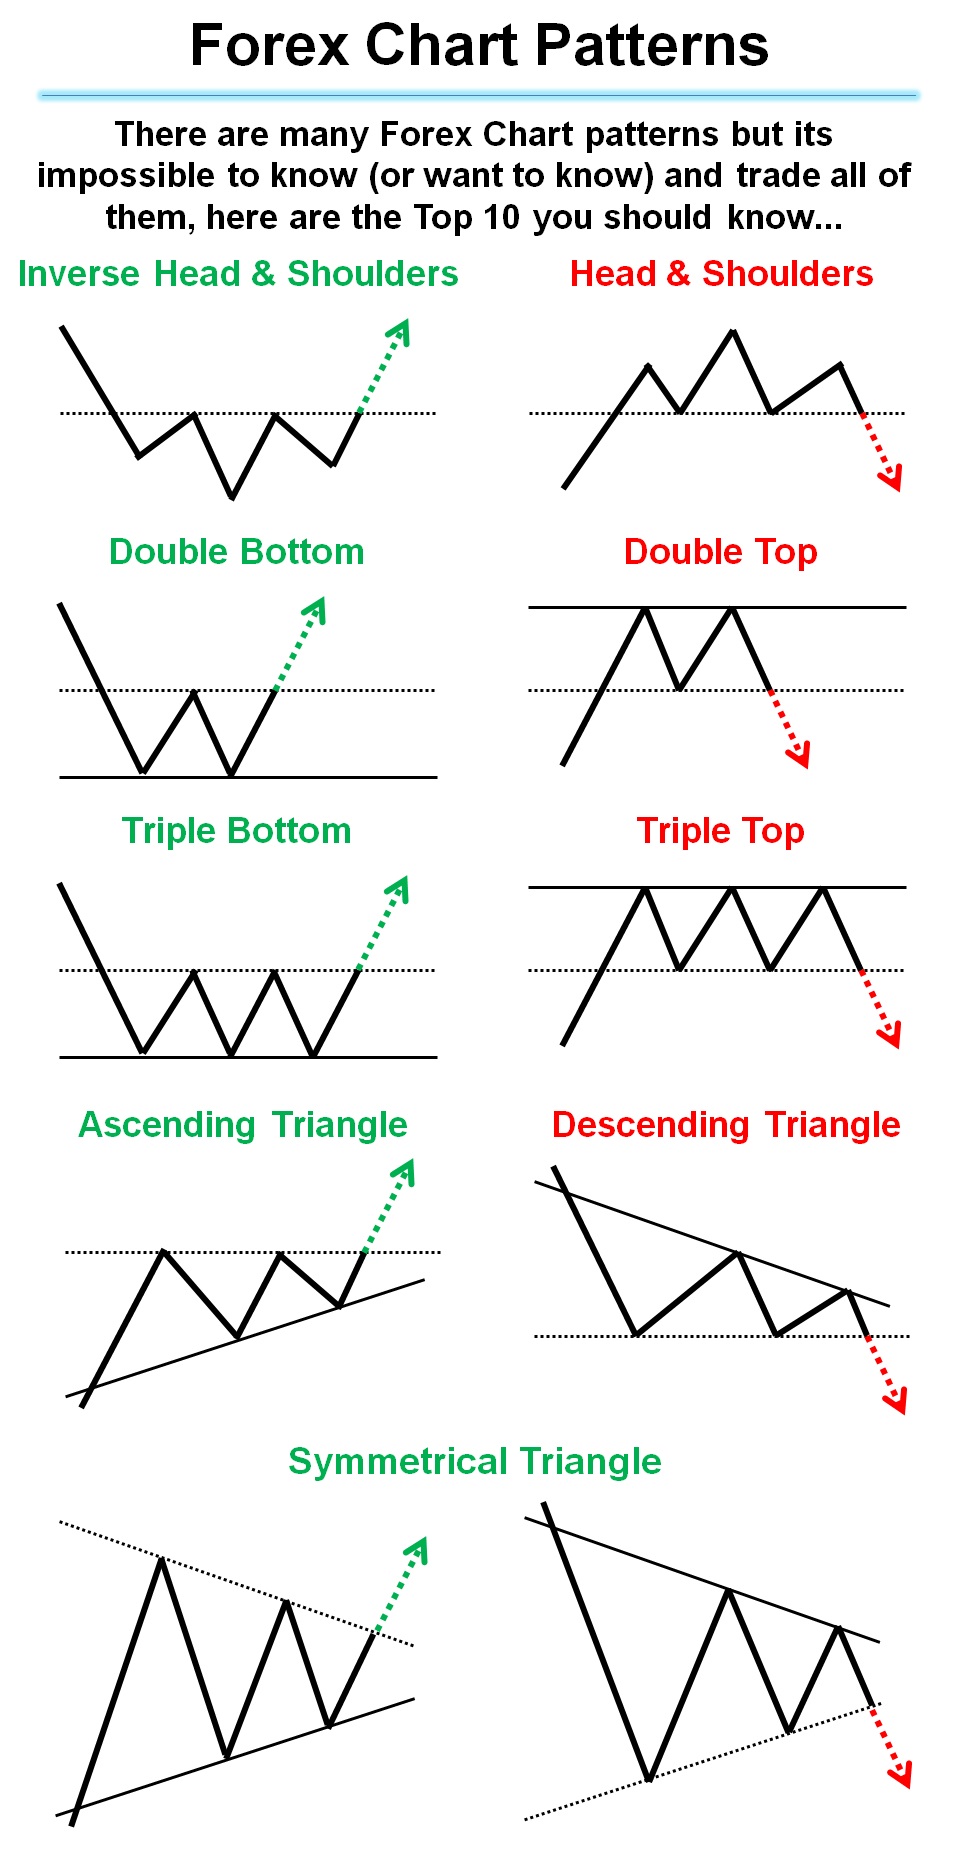
Traders who choose chart patterns as their trading method enjoy stability. They spend less time sitting in front of the screen but still make a steady profit compared to other methods. Does it sound attractive? It is, therefore, not surprising that successful traders always choose chart patterns to trade.
Let me introduce to you the Triangle chart pattern which has helped me earn money in IQ Option.
Triangle Pattern
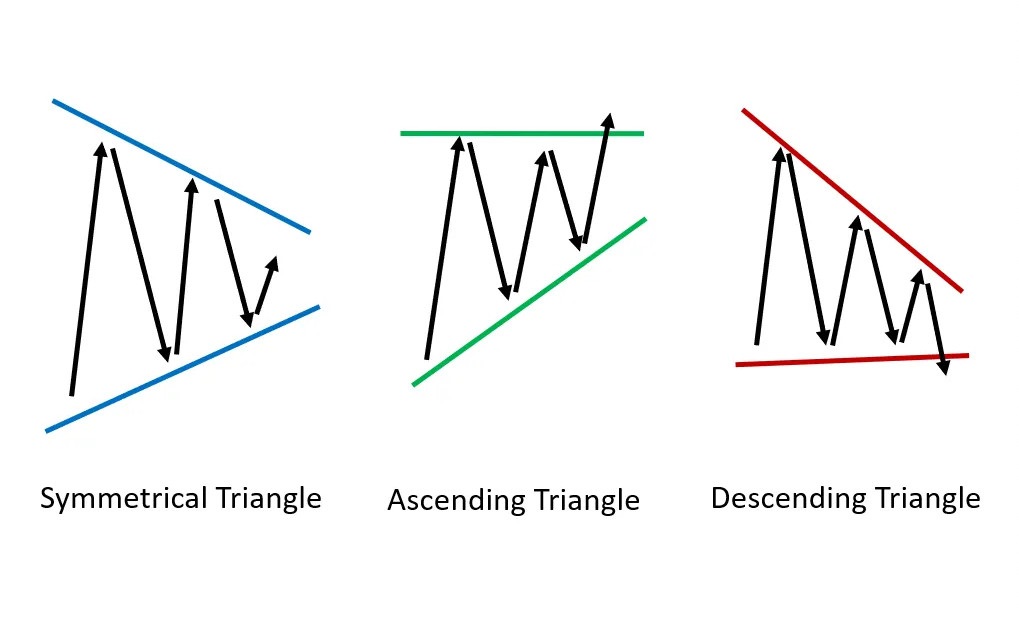
Triangle is a common market price continuation pattern. This pattern has a triangle shape on the left side shrinking gradually, creating the top of the triangle on the right side. Prices will fluctuate in the range of a resistance level and a support level that converge to the right. The Triangle pattern comes to an end when the price breaks out of either the resistance or support level and creates a new trend.
Characteristics of this pattern
– Before breaking out, prices need to touch both resistance and support levels at least twice each for the pattern to take effect.
– This pattern gives a buy signal (breaking out of the resistance) which is more effective than a sell signal (breaking out of the support).
Common types of Triangle patterns
The chart pattern has 3 different types as follows:
Symmetrical Triangle pattern
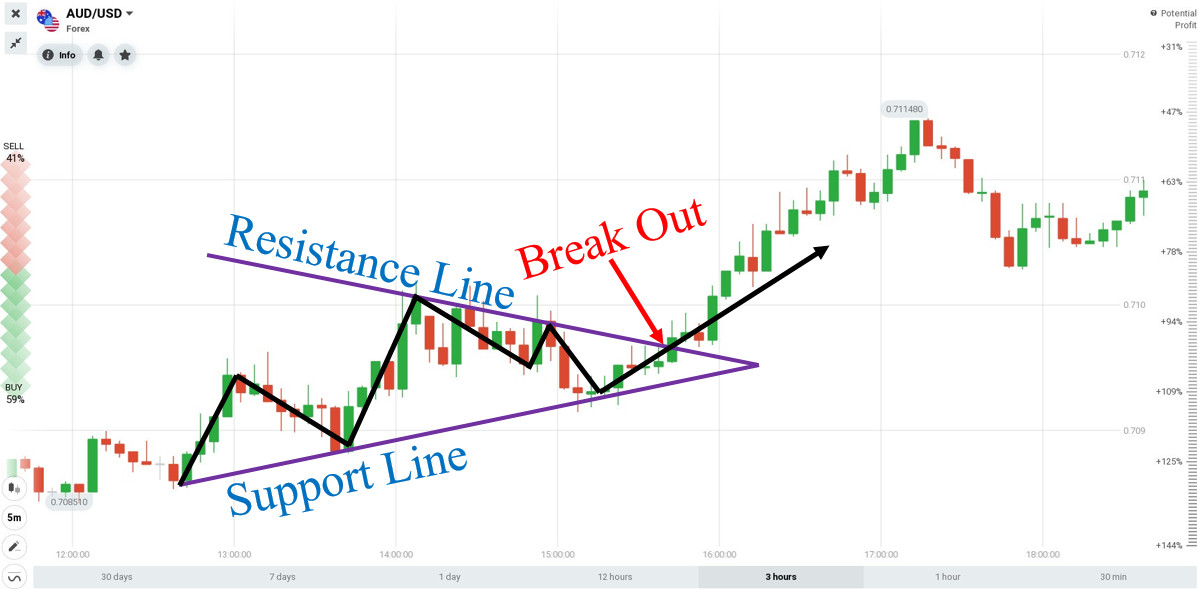
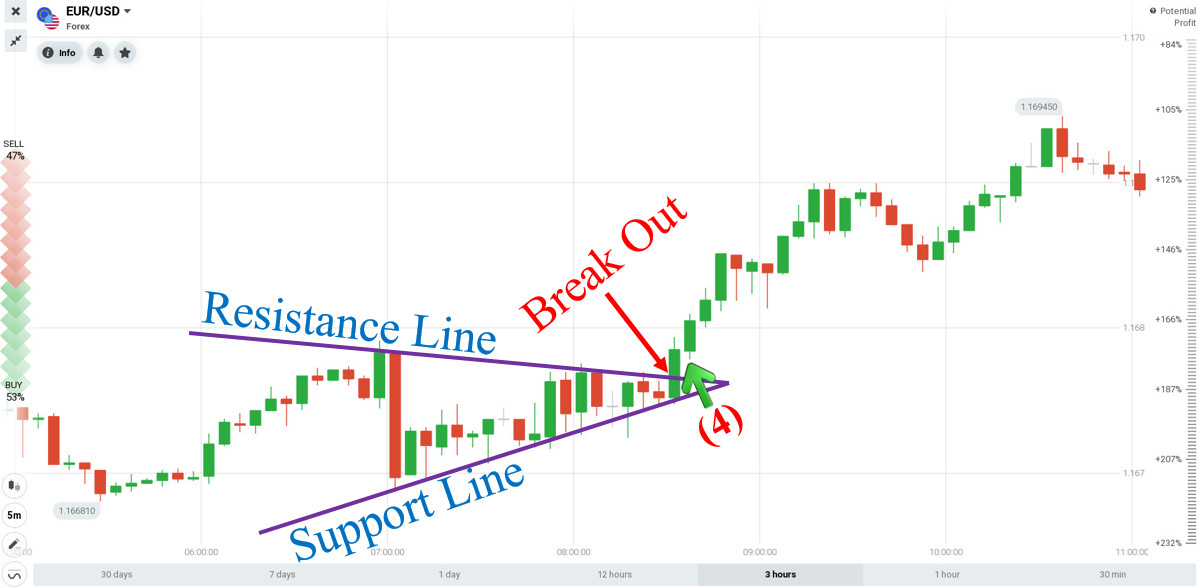
A Symmetrical Triangle pattern is formed from a descending resistance level and an ascending support level, converging at a point to the right, forming a symmetrical triangle.
Ascending Triangle pattern
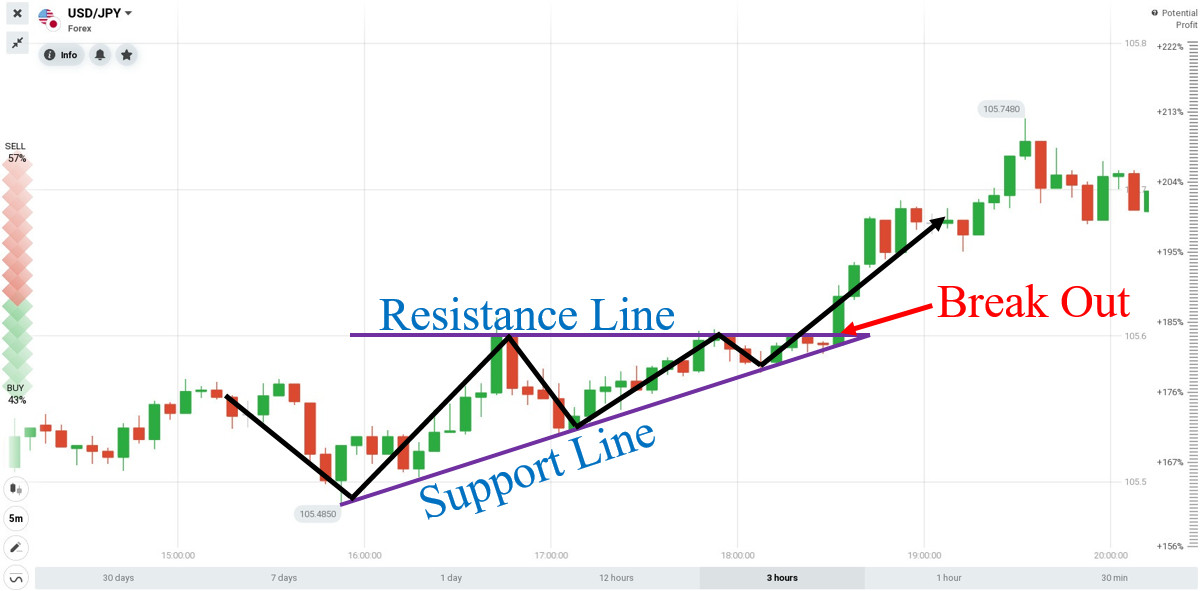
This pattern consists of a horizontal resistance level and an ascending support level, which converge at a point on the right to form an ascending triangle as shown below.
Descending Triangle pattern
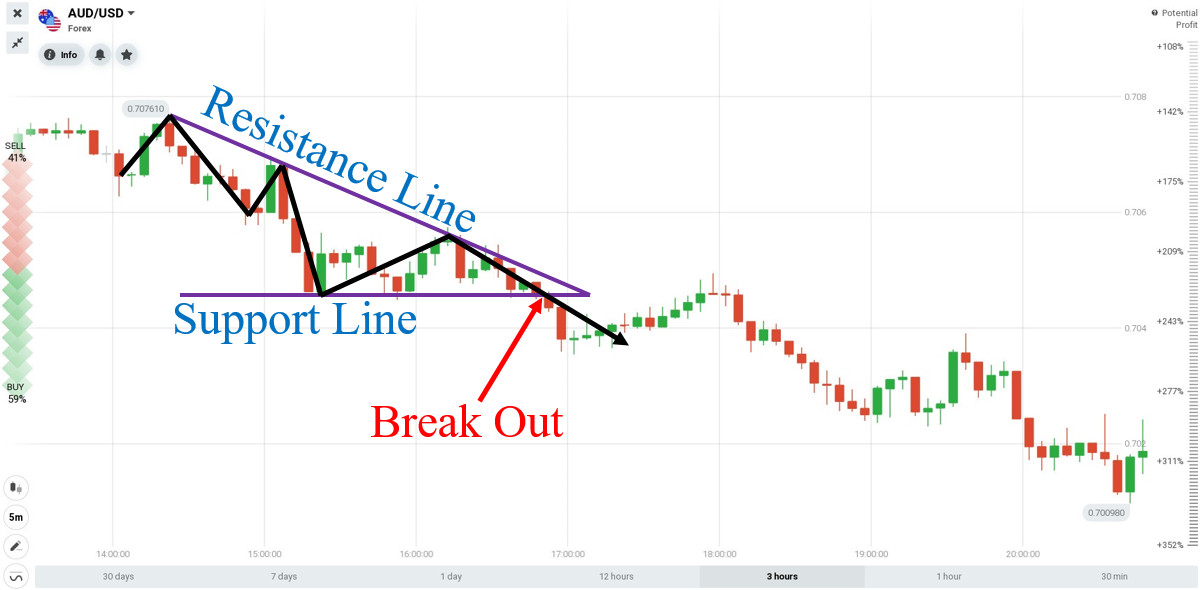
Finally, a Descending Triangle pattern consists of a descending resistance level and a horizontal support level. These two levels tend to converge at a point to the right, forming a descending triangle.
How to trade Forex effectively with a Triangle pattern
The Triangle pattern gives signals with both possibilities to trade in the direction of a price breakout. Here, I will guide you 2 ways to trade.
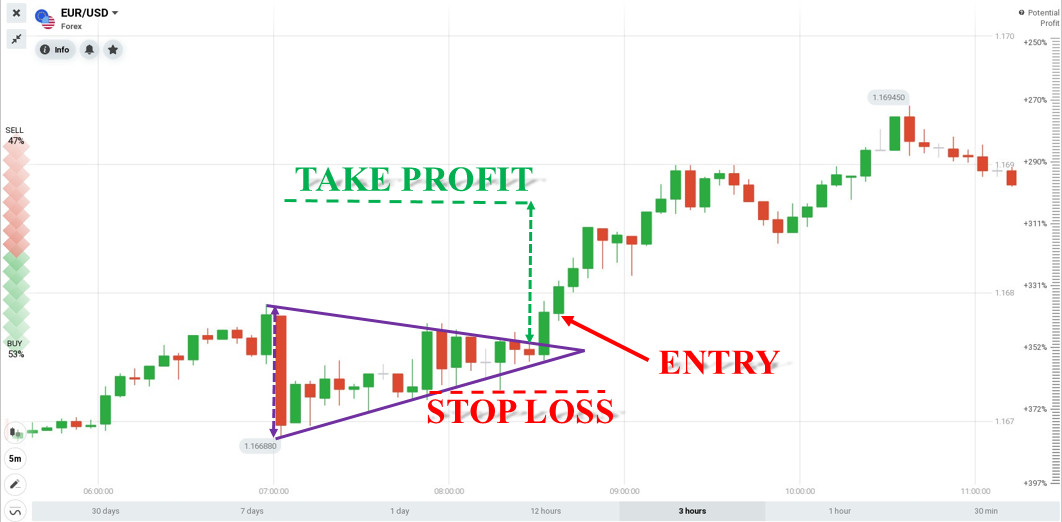
Open a BUY order when the price breaks out of the resistance, completing the pattern.
– Entry Point: When the candlestick breaks out of the resistance and closes above it.
– Stop-Loss: At the level where the price last hit the support before breaking out.
– Take-Profit: From the entry point, the length is equal to the widest price amplitude generated within the Triangle pattern.
Open a SELL order when the price breaks out of the support.
– Entry Point: When the candlestick breaks out of the support and closes below it.
– Stop Loss: At the level where the price last hit the support before breaking out.
– Take Profit: From the entry point, the length is equal to the widest price amplitude generated within the Triangle pattern.
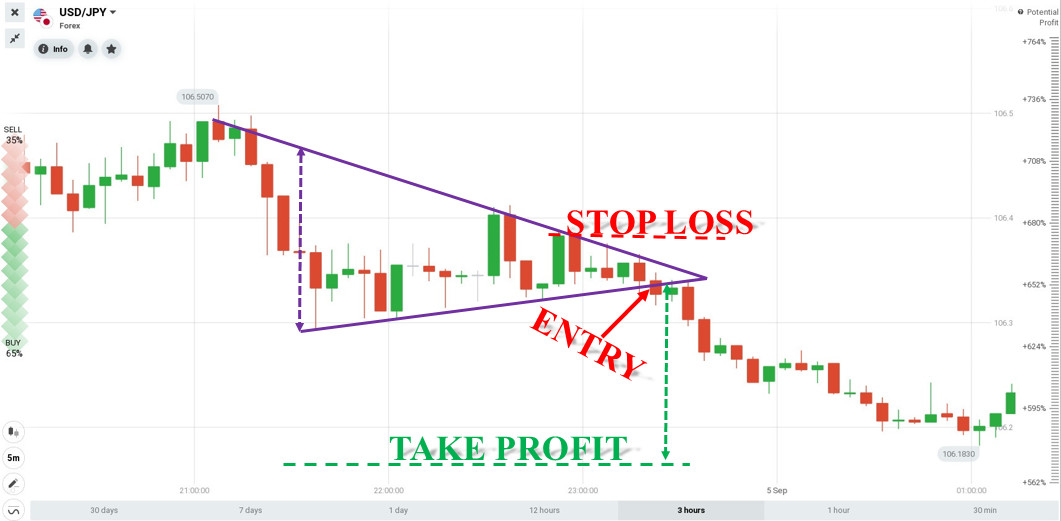
Review on opened Forex orders using the Triangle pattern in IQ Option
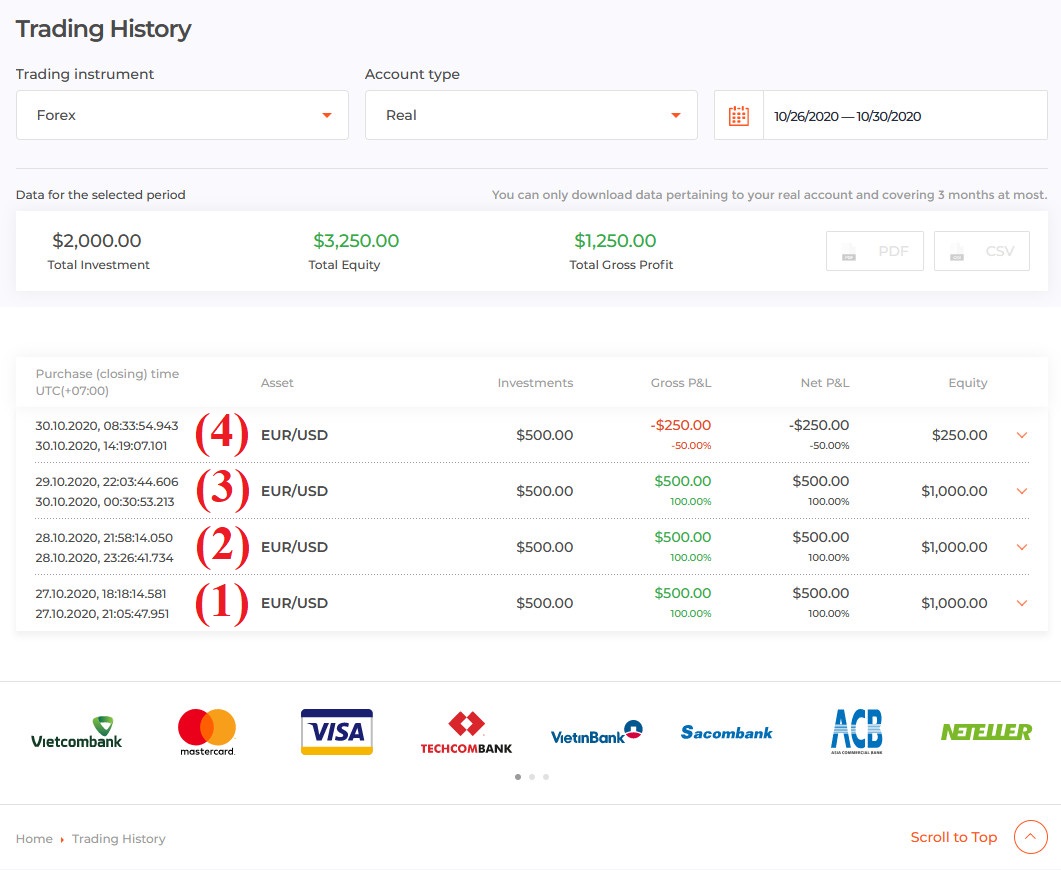
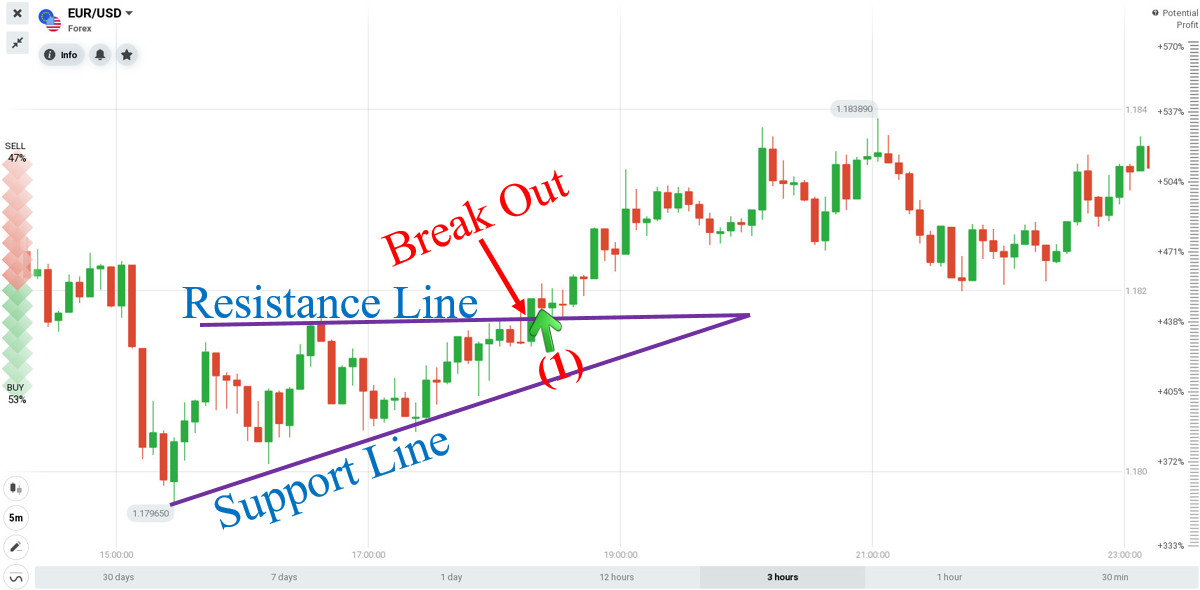
1st order: On October 27, an Ascending Triangle pattern appeared in the EUR/USD pair. Opened a BUY order when the signal candlestick broke out of the resistance level and closed above it => The result was a 100% profit.
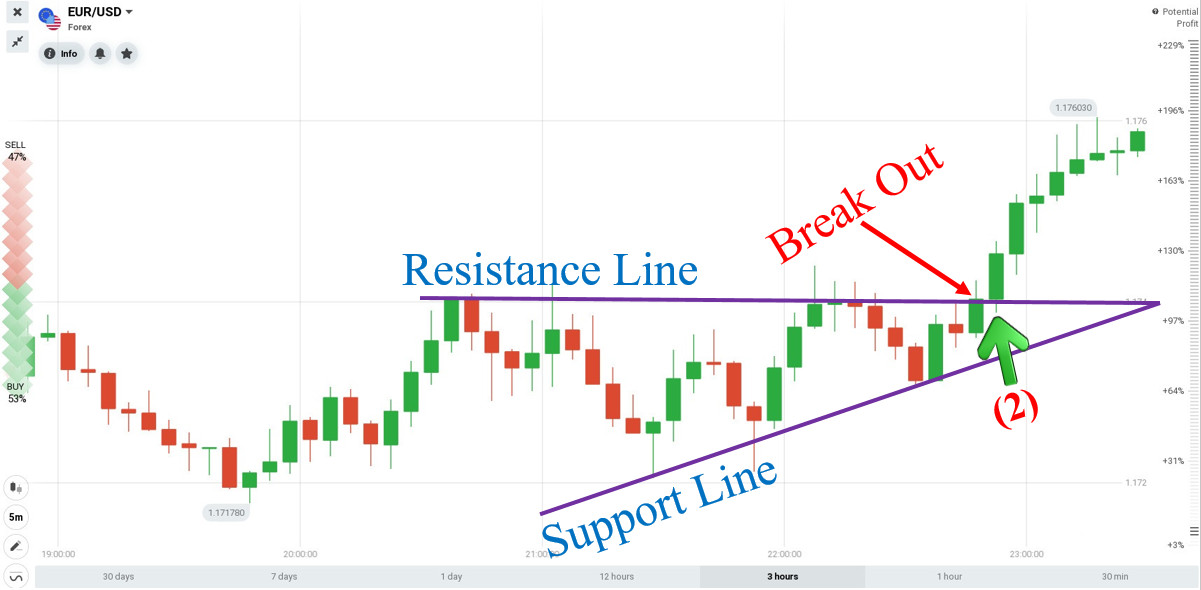
2nd order: On October 28, an Ascending Triangle pattern formed in the EUR/USD pair. Placed a BUY order when the signal candlestick broke out of the resistance level and closed above it => The result was a 100% profit.
3rd order: At the end of October 29, a Descending Triangle pattern formed in the EUR/USD pair. Opened a SELL order when the signal candlestick broke out of the support level and definitively closed below it => The result was a 100% profit.
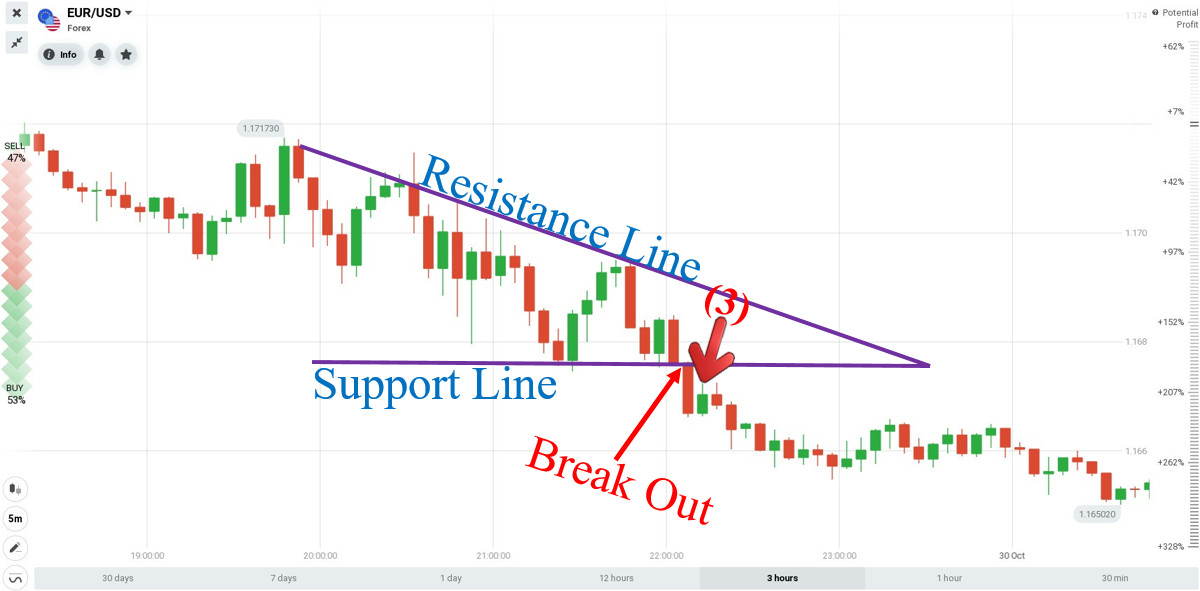
4th order: On October 30, a Symmetrical Triangle pattern formed in the EUR/USD pair. Placed a BUY order when the price broke out of the resistance level with a long green candle that closed above it => The result was losing 50% of the investment ($250).
Especially, when trading Forex in IQ Option, you can set a stop-loss and take-profit equal to a percentage of the invested amount. For example, If the investment is $500 (100%), the stop-loss should be 50% ($250) and the take-profit should be 100% ($500). That means you will lose $250 (50%) if losing and receive $500 (100%) if winning. You can customize it to suit each trading strategy.
In conclusion
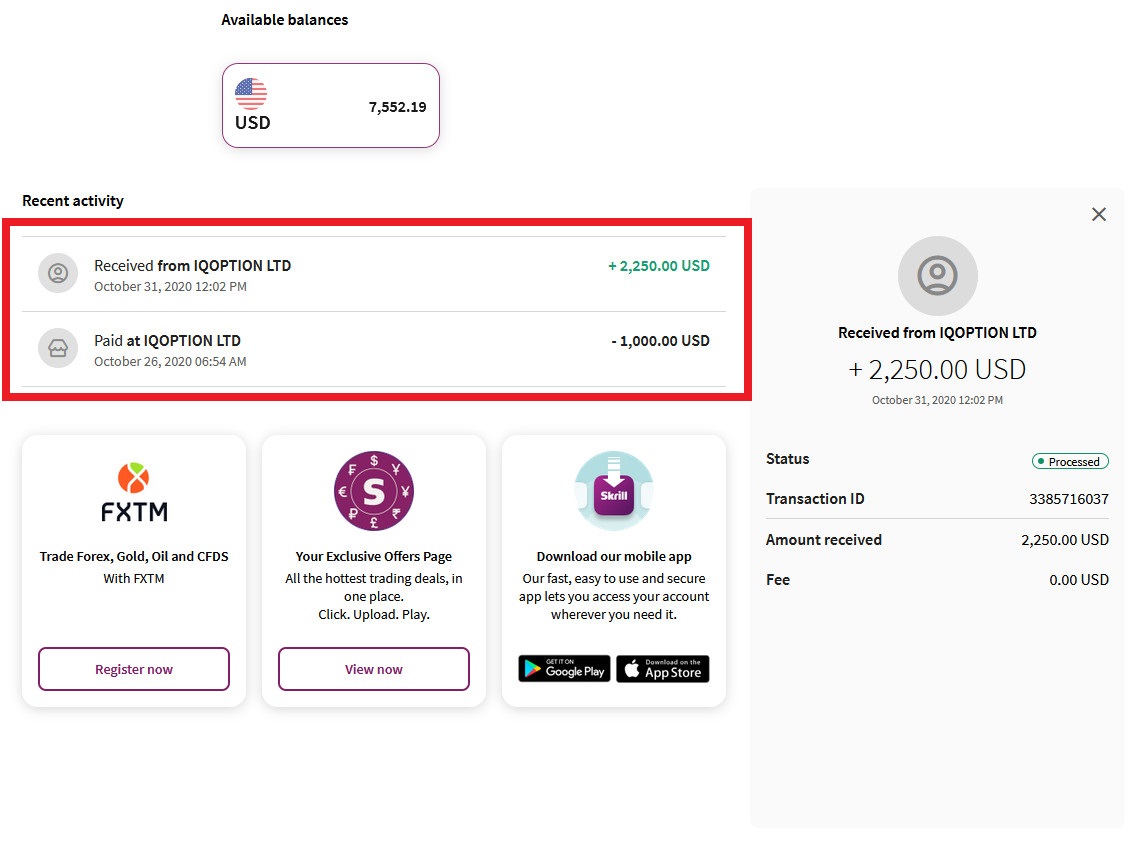
It’s convenient to trade options and Forex on the same IQ Option trading platform. You can switch from a short-term investment (options) channel to a long-term money-making (Forex) channel with just a few simple steps. It helps you to capture money-making opportunities in every market movement.
For trading on the Triangle pattern, you need to practice on a Demo account to accumulate experience. If not, you will not be able to recognize the money-making opportunities hovering in front of the screen. The worst thing about it is that misrecognizing the pattern causes you to lose money unreasonably.
 English
  Indonesia
  Português
  Tiếng Việt
  ไทย
ไทย  العربية
  हिन्दी
  简体中文
简体中文  Nederlands
  Français
  Deutsch
  हिन्दी
  Italiano
  한국어
한국어  Melayu
  Norsk bokmål
  Español
  Svenska
  Tamil
Tamil  Türkçe
  Zulu
Zulu
