 English
  Indonesia
  Tiếng Việt
  ไทย
ไทย  العربية
  हिन्दी
  简体中文
简体中文  Nederlands
  Français
  Deutsch
  हिन्दी
  Italiano
  한국어
한국어  Melayu
  Norsk bokmål
  Русский
  Español
  Svenska
  Tamil
Tamil  Türkçe
  Zulu
Zulu
For beginners who are not fully equipped with chart reading knowledge, the simplicity factor is at the forefront. For that simplicity, we should look to popular, easy-to-use indicators. If you are still learning about the world of options, then I think a trading strategy using EMA indicator for trend trading will work for you.
Registre a IQ Option e ganhe $10.000 grátis Risk warning: Your capital might be at risk.
What is EMA indicator?
EMA is one of the two most commonly used Moving Averages (MA).
EMA belongs to a group of indicators that are very popular in technical analysis. It helps to determine the weights of the most recent data. With that calculation, it will help to make the path more accurate than other MAs.
This means that EMA will respond more quickly and accurately to a change in the price action of a particular currency pair. EMA is an important part of many traders’ strategy. Because it can be combined with other technical indicators to bring high efficiency
Characteristics of the EMA
The EMA is a better trend follower because it has a higher weight for the latest data and has faster changes compared to the SMA.
The rising slope of the EMA reflects the optimistic sentiment of the market. On the contrary, if it is reduced, this represents a pessimistic and fearful sentiment.
The relatively narrow time frame of observation makes the EMA sensitive to price movements. That means it soon catches the trend but makes you easily get trapped. Traps are a quick reversal of the market.
EMAs with longer time frames of observation create fewer traps but abandon more reversal points. Therefore, it is necessary to choose a time frame that suits your trading strategy.
What are the advantages of EMA over SMA?
The EMA indicator has a remarkable advantage over the SMA. Let’s take a look at some of its advantages.
First, it allocates a greater weight to the most recent trading day. That means the crowd’s nearest sentiment is of utmost importance.
Second, the EMA is always up-to-date as it constantly updates new price data. It helps investors to keep abreast of price movements at that moment. Hence, the current price using the EMA will not be affected much by historical prices.

Principles to know when using the EMA indicator
EMA is a useful and preferred indicator for short-term traders. They often look at the indicator and make quick decisions on their trades. The EMA works independently and you can combine it with any other tool to complete the overall picture of your strategy.
Before determining the path of the EMA indicator, you need to know how to understand its language. There are a few principles with this exponential moving average as follows:
- With a long time frame, the EMA gives you a better view of the overall trend of the market and the price path on the chart.
- Drawing short EMAs nested with long-term EMAs will help you identify better cross opportunities.
- Signal to buy if the EMA goes up. When the price falls close to the moving average, it is a signal to buy.
- Signal to sell if the EMA turns down. You should follow the sellers when the price crosses the EMA from above.

How to trade with 2 EMAs in IQ Option
This is a trading strategy of determining crosses when referencing two different EMAs. The conditions are as follows:
- A 1-minute candlestick chart
- Only open orders after 2 EMAs cross each other.
- The expiration time of 15 minutes.
Open an UP order when the price is above the EMA50 and EMA150 (Price> EMA50> EMA150). At the same time, the Stochastic indicator is in the oversold zone (below the 20 line).
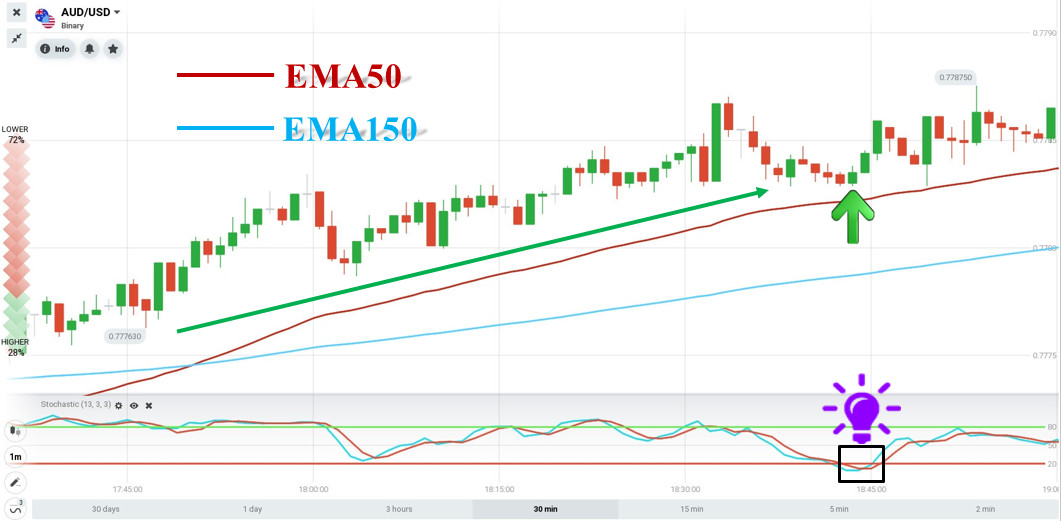
Open a DOWN order when the price is below the EMA50 and EMA150 (Price< EMA50< EMA150). At the same time, the Stochastic indicator is in the overbought zone (above the 80 line).
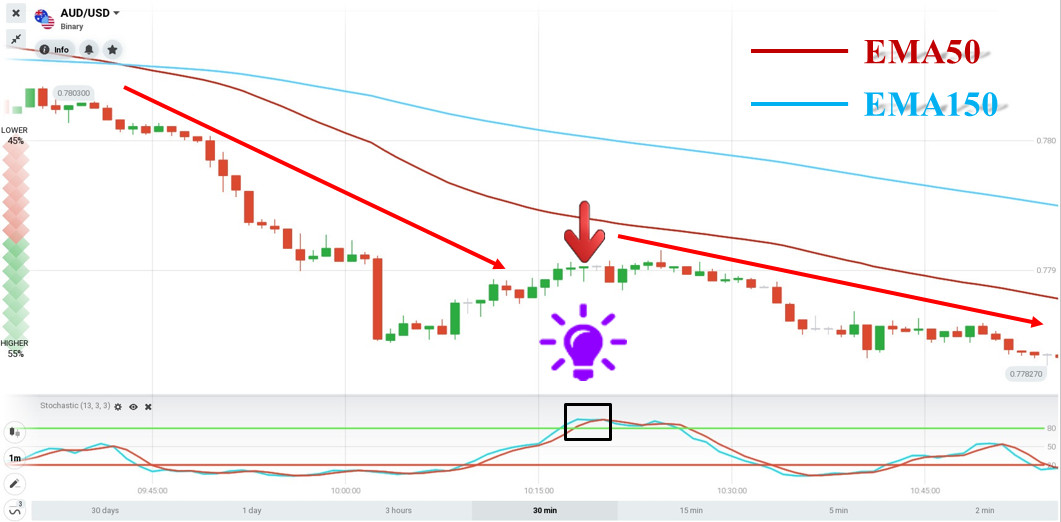
Notes when using this trading strategy
Just like any other trading strategy, you need to pay attention to the following points to avoid losses.
- Do not open orders before and after the news release time
- Do not enter when the market has lost its trend.
- After 2 EMAs create a new trend (cross each other), only open one order in that trend. Only when the 2 EMAs cross will new orders be ready.
First, let’s trade on a Demo account to get the best feeling about this trading strategy. Do not be too impatient in investing to avoid unnecessary risks. I hope you find the strategy that works for you.
Registre a IQ Option e ganhe $10.000 grátis Risk warning: Your capital might be at risk.
 English
  Indonesia
  Tiếng Việt
  ไทย
ไทย  العربية
  हिन्दी
  简体中文
简体中文  Nederlands
  Français
  Deutsch
  हिन्दी
  Italiano
  한국어
한국어  Melayu
  Norsk bokmål
  Русский
  Español
  Svenska
  Tamil
Tamil  Türkçe
  Zulu
Zulu
